B. subtilis Expression Data Browser
Start Page
B. subtilis Expression Data Browser
Gene/Segment:
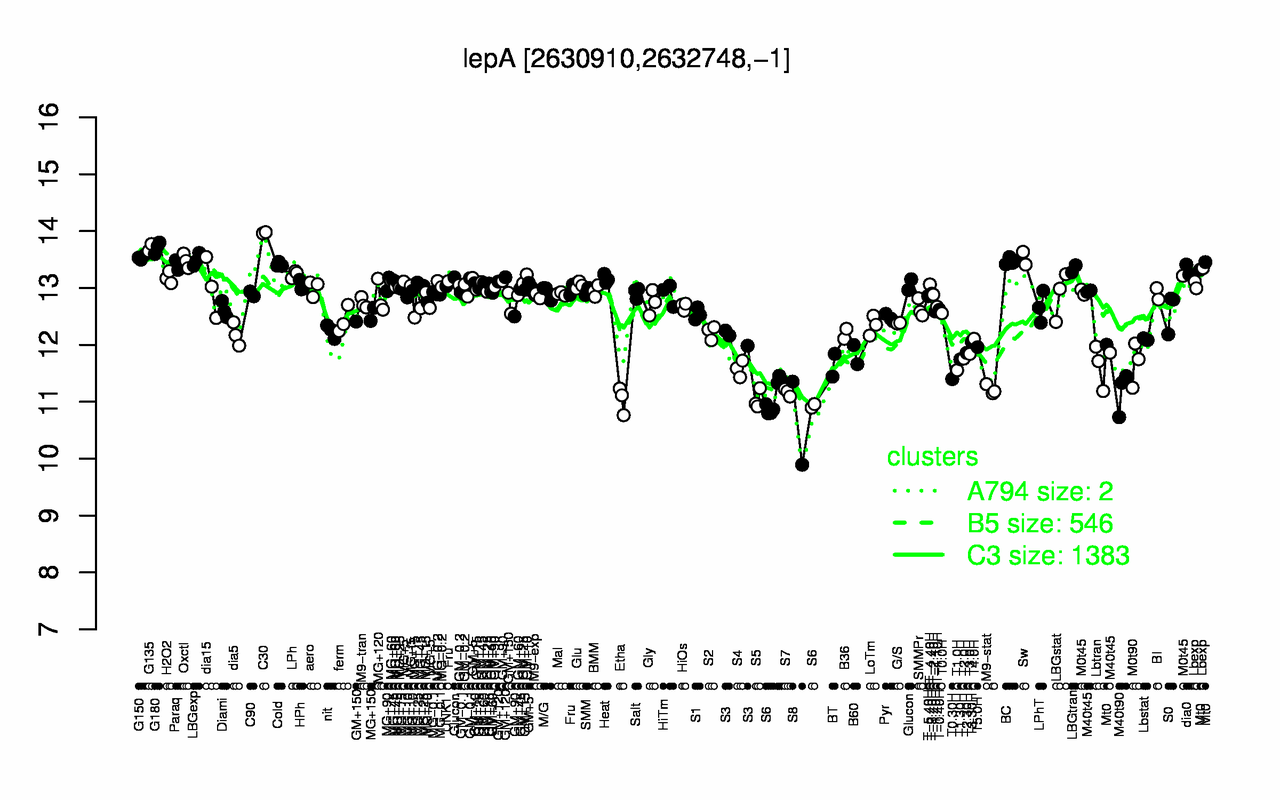
lepA
Locus Tag:
BSU25510
Details about lepA
Show/Hide
Highest Expression Conditions
C30
G180
G135
G150
Sw
LBGexp
Oxctl
BC
Cold
Paraq
14
13.7
13.7
13.5
13.5
13.5
13.5
13.5
13.4
13.4
Lowest Expression Conditions
S8
Etha
S5
S6
S7
M40t90
M9-stat
T0.30H
T1.0H
S4
10.6
11
11
11
11.2
11.2
11.2
11.4
11.6
11.6
Most Positively Correlated Segments
gyrA
dacA
rpsI
ftsX
rpsD
oxaAA
mreD
mreC
jag
ispE
0.88
0.88
0.87
0.86
0.85
0.85
0.85
0.85
0.85
0.85
Most Negatively Correlated Segments
S427
yhzD
yvaM
amyC
yycO
ytpI
S402
yjaZ
ylaJ
yngHA
-0.77
-0.77
-0.75
-0.73
-0.73
-0.73
-0.73
-0.72
-0.72
-0.72
Expression Profile of Segment lepA
Show/Hide
Annotation of Gene lepA
Show/Hide
function
16.2: Construct biomass (Anabolism)
function
16.6: Maintain
inference
ab initio prediction:AMIGene:2.0
codon_start
1
product
ribosomal elongation factor, GTPase
transl_table
11
note
Evidence 2a: Function of homologous gene experimentally demonstrated in an other organism; PubMedId: 17110332; Product type e: enzyme
db_xref
GI:2634997
protein_id
CAB14493.1
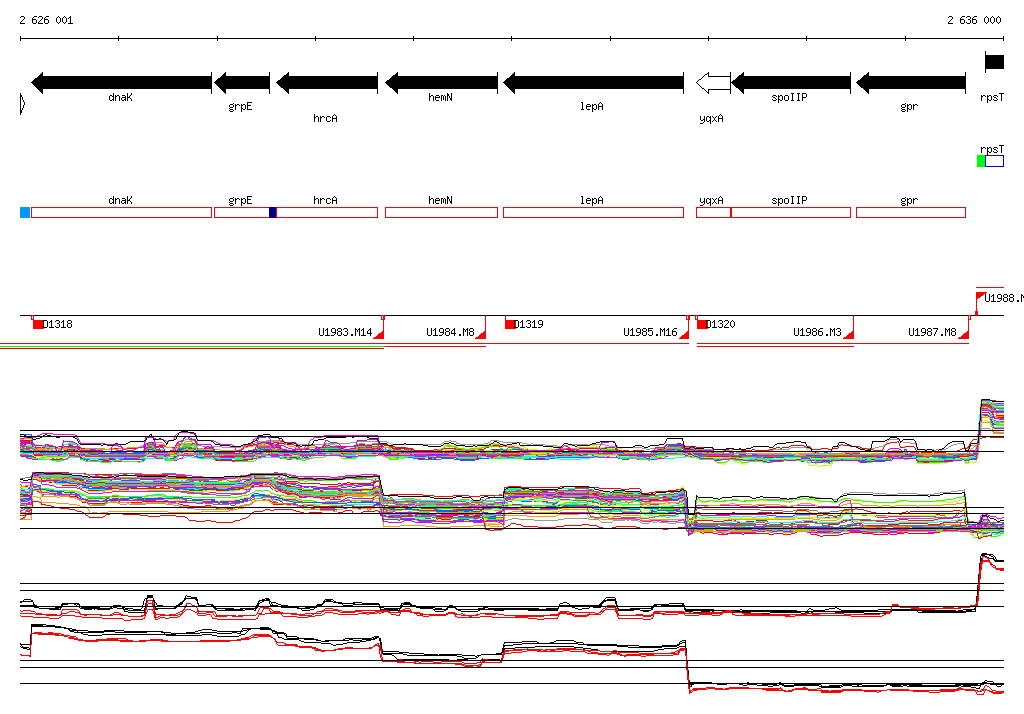
Genomic View of Gene/Segment lepA
Show/Hide
(Legend)
Browse Genome Context