| Start Page |
|
 |
| Start Page |
|
|
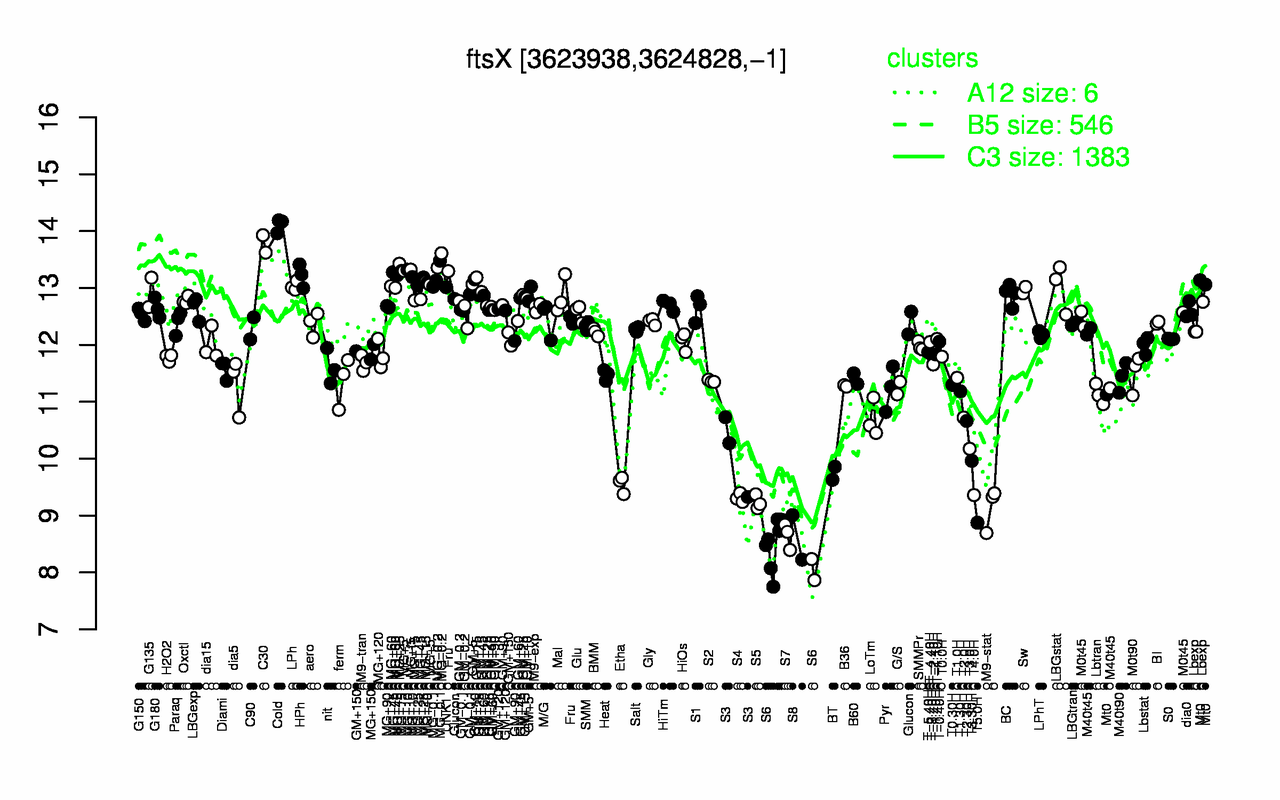
| Cold | C30 | MG-0.2 | MG+t5 | MG+25 | HPh | MG-0.1 | MG+10 | MG+5 | MG+45 |
| 14.1 | 13.8 | 13.5 | 13.3 | 13.2 | 13.2 | 13.2 | 13.2 | 13.2 | 13.1 |
| S6 | S8 | S7 | T5.0H | M9-stat | S5 | S4 | T4.0H | Etha | BT |
| 8.4 | 8.62 | 8.65 | 8.87 | 9.14 | 9.23 | 9.31 | 9.36 | 9.55 | 9.74 |