| Start Page |
|
 |
| Start Page |
|
|
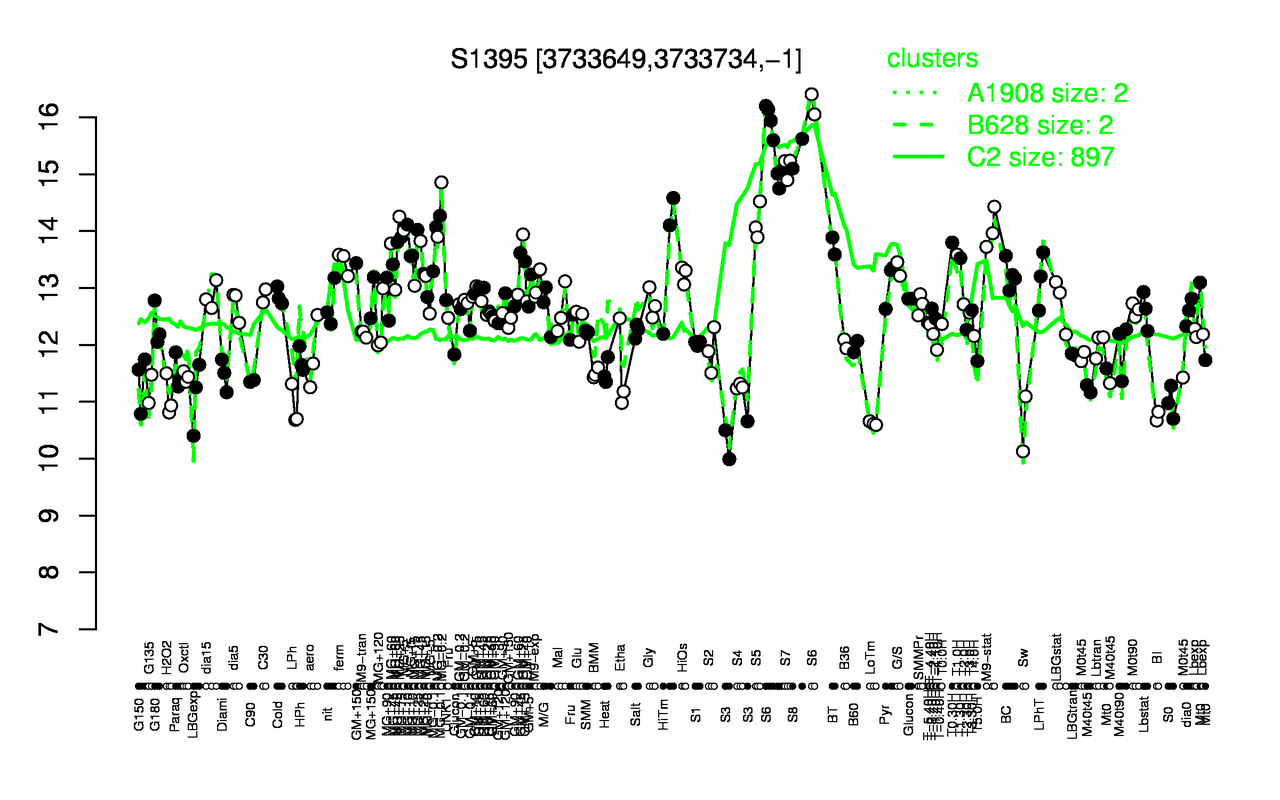
| S6 | S8 | S7 | MG-0.2 | S5 | M9-stat | MG-0.1 | MG+25 | T0.30H | BT |
| 15.7 | 15.4 | 15.1 | 14.4 | 14.2 | 14 | 13.9 | 13.8 | 13.8 | 13.7 |
| S3 | Sw | LoTm | BI | LPh | S0 | H2O2 | LBGexp | G135 | M40t45 |
| 10.4 | 10.6 | 10.6 | 10.7 | 10.9 | 11 | 11.1 | 11.1 | 11.2 | 11.3 |