B. subtilis Expression Data Browser
Start Page
B. subtilis Expression Data Browser
Gene/Segment:
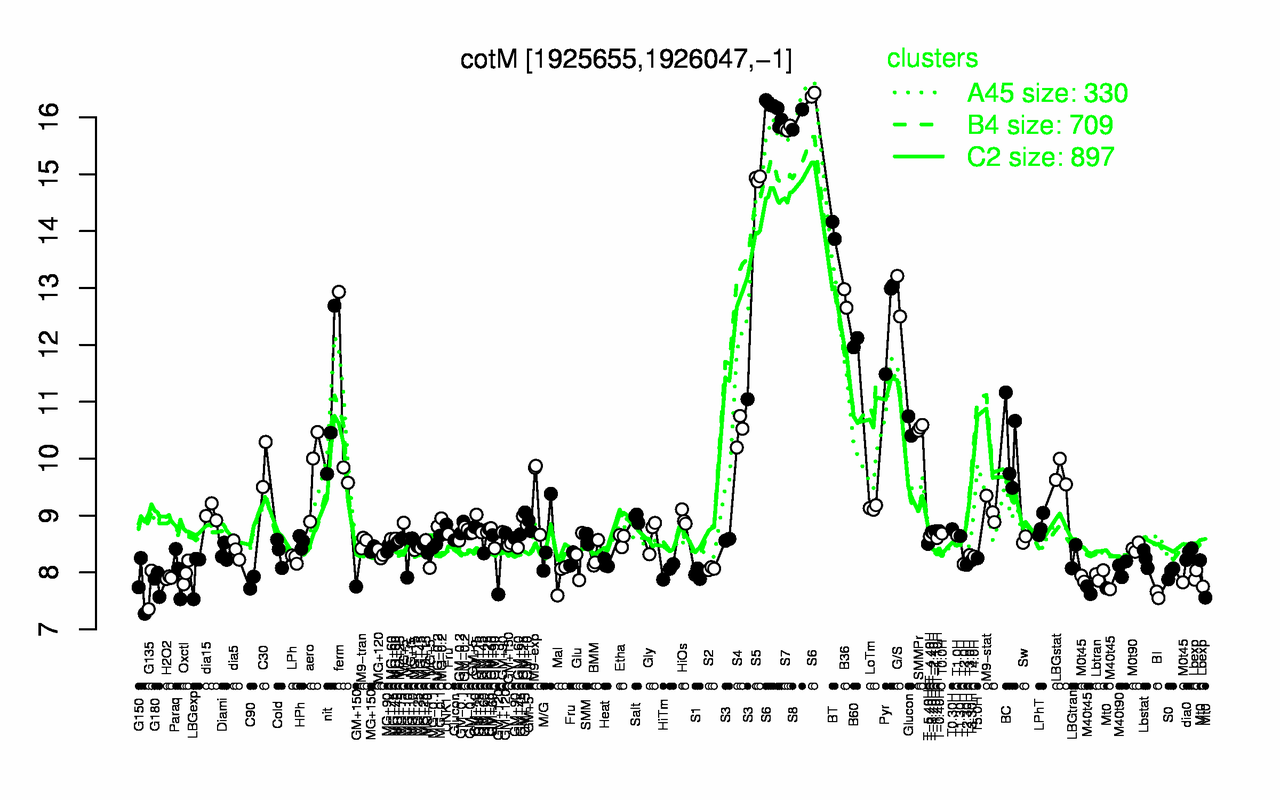
cotM
Locus Tag:
BSU17970
Details about cotM
Show/Hide
Highest Expression Conditions
S6
S8
S7
S5
BT
G/S
B36
Pyr
B60
nit
16.2
16
15.8
14.9
14
12.9
12.8
12.5
12
11
Lowest Expression Conditions
BI
G135
M40t45
G150
G180
C90
Mt0
M0t45
Lbexp
H2O2
7.61
7.69
7.69
7.76
7.82
7.82
7.83
7.87
7.89
7.91
Most Positively Correlated Segments
cotP
ydgB
ydgA
gerT
ytlA
ysnD
gerPF
ytlC
ytlD
S394
0.97
0.97
0.97
0.97
0.97
0.97
0.97
0.97
0.97
0.97
Most Negatively Correlated Segments
yviA
yeaC
yvrG
S1355
yulF
bceR
yeeC
moeB
parA
yvcP
-0.84
-0.84
-0.84
-0.84
-0.84
-0.84
-0.84
-0.83
-0.83
-0.83
Expression Profile of Segment cotM
Show/Hide
Annotation of Gene cotM
Show/Hide
function
16.8: Protect
function
16.13: Shape
inference
ab initio prediction:AMIGene:2.0
codon_start
1
product
spore coat protein (outer)
transl_table
11
note
Evidence 1a: Function experimentally demonstrated in the studied strain; PubMedId: 11150673, 9068633; Product type m: membrane component
db_xref
GI:2634181
protein_id
CAB13681.1
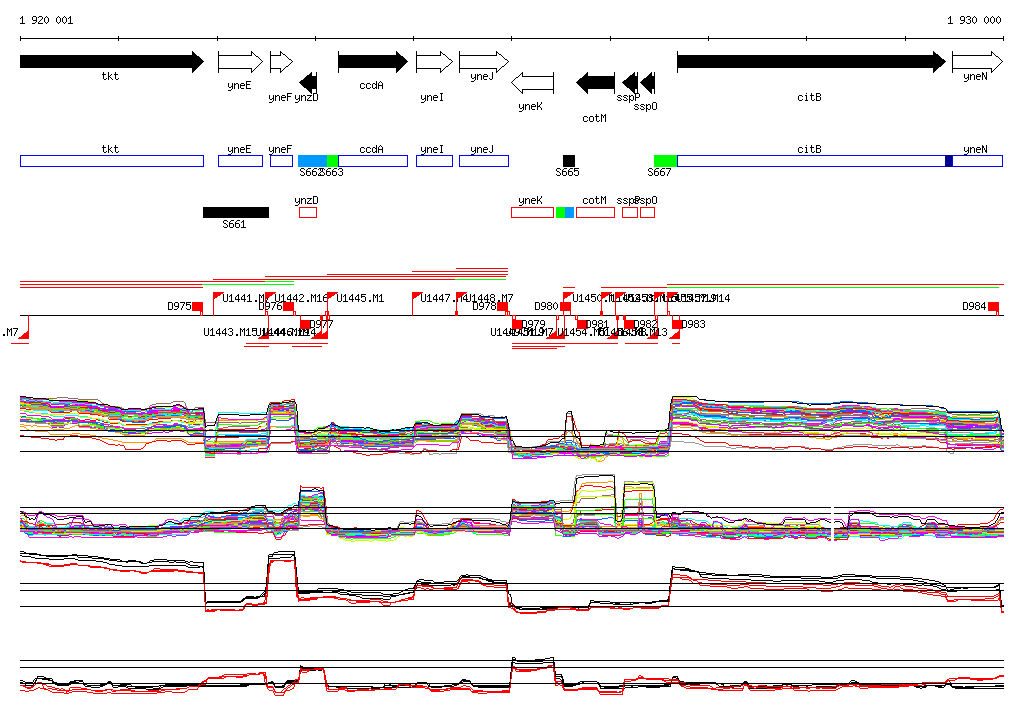
Genomic View of Gene/Segment cotM
Show/Hide
(Legend)
Browse Genome Context