B. subtilis Expression Data Browser
Start Page
B. subtilis Expression Data Browser
Gene/Segment:
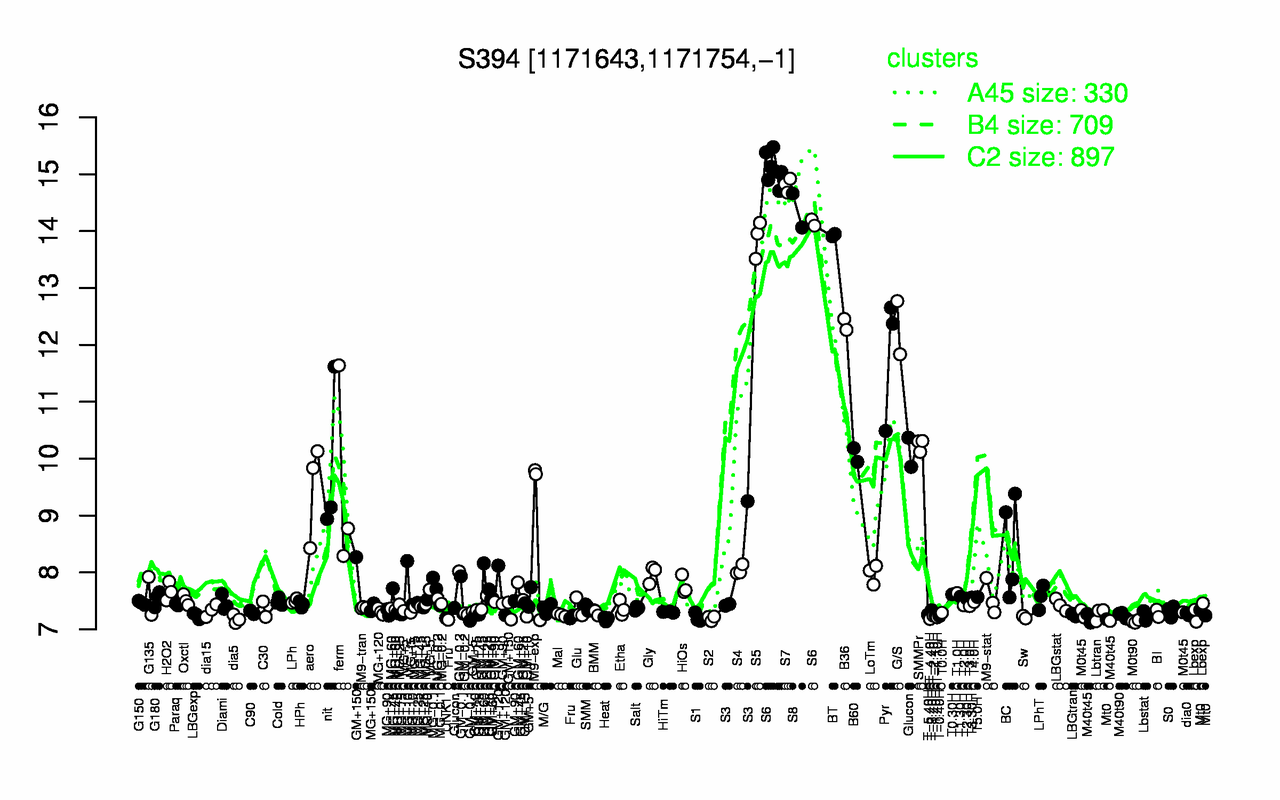
S394
Locus Tag:
new_1171643_1171754_c
Details about S394
Show/Hide
Highest Expression Conditions
S6
S7
S8
BT
S5
B36
G/S
Pyr
SMMPr
B60
14.9
14.8
14.4
13.9
13.9
12.4
12.3
11.8
10.2
10.1
Lowest Expression Conditions
M0t90
M40t45
Heat
dia5
T-4.40H
S2
UNK1
Fru
S1
T-1.10H
7.14
7.18
7.18
7.18
7.18
7.2
7.2
7.2
7.21
7.21
Most Positively Correlated Segments
yisZ
yitA
ytcA
yitC
yitB
ytcB
ytcC
gerT
yitD
ydgA
0.99
0.99
0.99
0.99
0.99
0.99
0.99
0.99
0.98
0.98
Most Negatively Correlated Segments
bceR
yeaC
bceS
S1355
S1189
ykuH
moeB
pbpD
dnaB
aroC
-0.83
-0.81
-0.81
-0.8
-0.8
-0.8
-0.8
-0.8
-0.79
-0.79
Expression Profile of Segment S394
Show/Hide
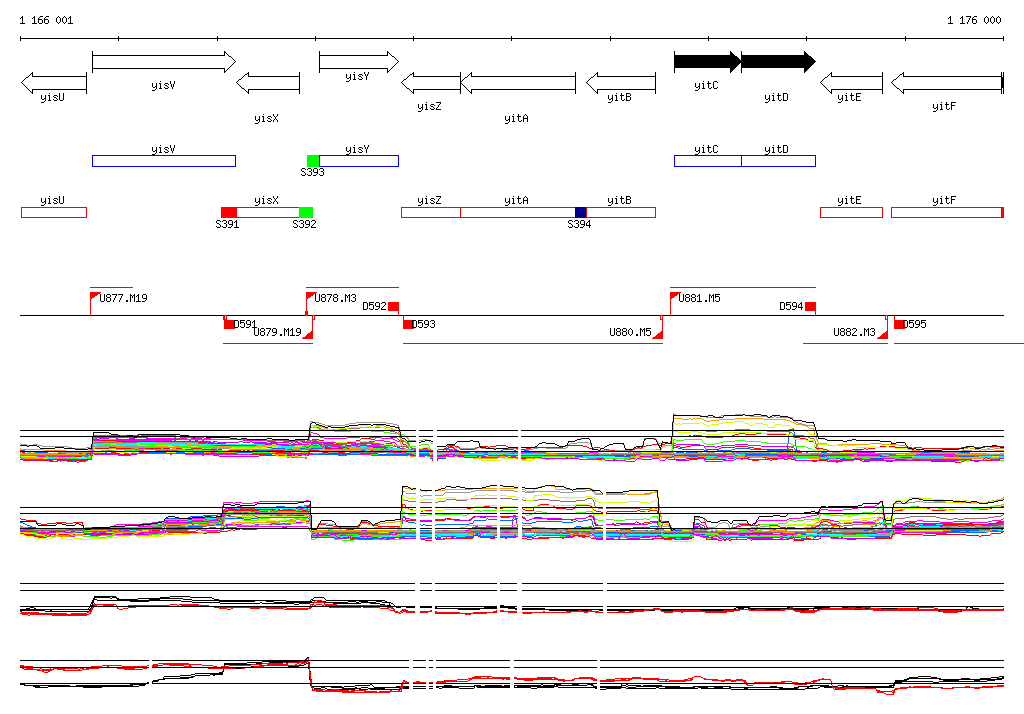
Genomic View of Gene/Segment S394
Show/Hide
(Legend)
Browse Genome Context