B. subtilis Expression Data Browser
Start Page
B. subtilis Expression Data Browser
Gene/Segment:
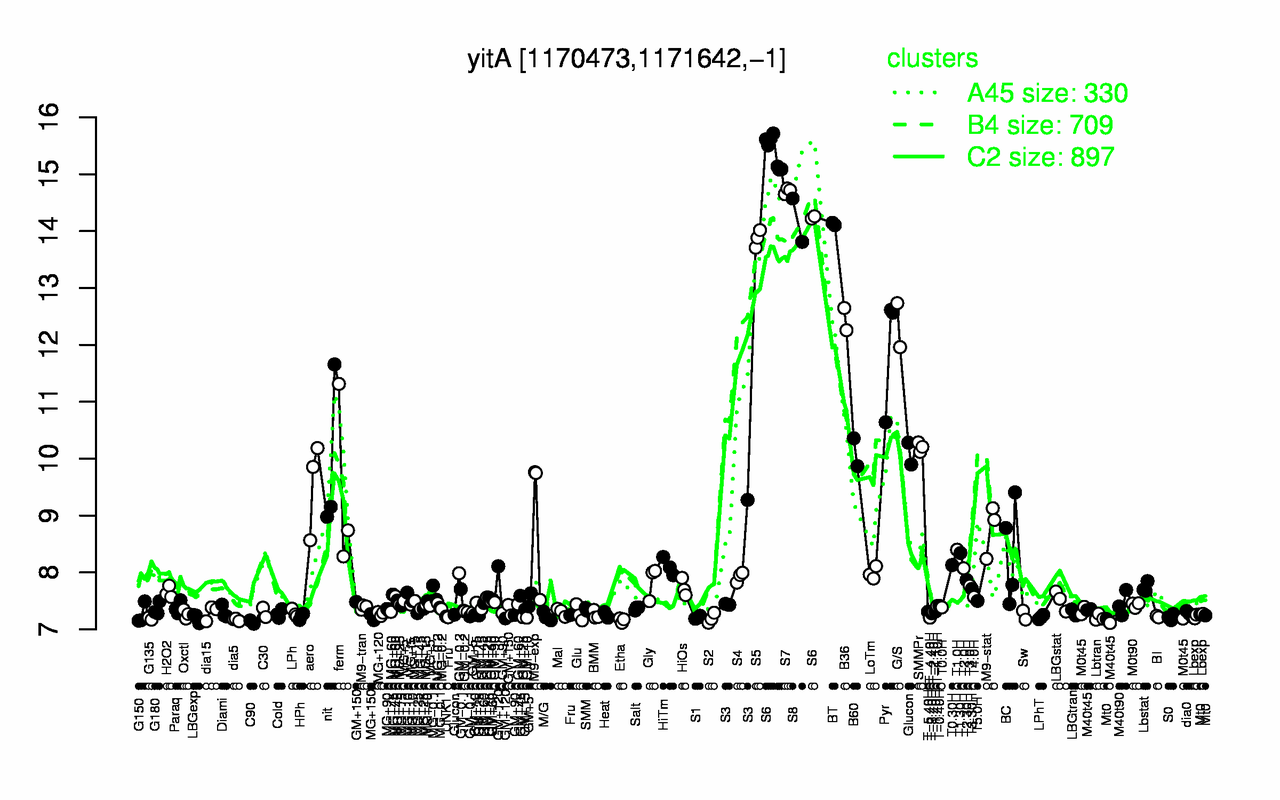
yitA
Locus Tag:
BSU10920
Details about yitA
Show/Hide
Highest Expression Conditions
S6
S7
S8
BT
S5
B36
G/S
Pyr
SMMPr
B60
15.1
14.7
14.2
14.1
13.9
12.5
12.3
11.9
10.2
10.1
Lowest Expression Conditions
C90
Etha
dia5
G135
S2
LBGexp
T-4.40H
S1
Lbtran
LPhT
7.13
7.16
7.17
7.19
7.2
7.2
7.2
7.21
7.21
7.21
Most Positively Correlated Segments
yisZ
S394
ytcA
yitB
yitC
ytcB
ytcC
gerT
yitD
ydgA
1
0.99
0.99
0.99
0.99
0.99
0.98
0.98
0.98
0.98
Most Negatively Correlated Segments
yeaC
bceR
yvrG
bceS
moeB
yeeC
S1189
yviA
ylbG
dnaB
-0.82
-0.82
-0.81
-0.8
-0.8
-0.8
-0.8
-0.8
-0.79
-0.79
Expression Profile of Segment yitA
Show/Hide
Annotation of Gene yitA
Show/Hide
function
16.5: Explore
inference
ab initio prediction:AMIGene:2.0
codon_start
1
product
putative sulfate adenylyltransferase
transl_table
11
note
Evidence 3: Function proposed based on presence of conserved amino acid motif, structural feature or limited homology; PubMedId: 15383836; Product type pe : putative enzyme
db_xref
GI:32468733
protein_id
CAB12932.2
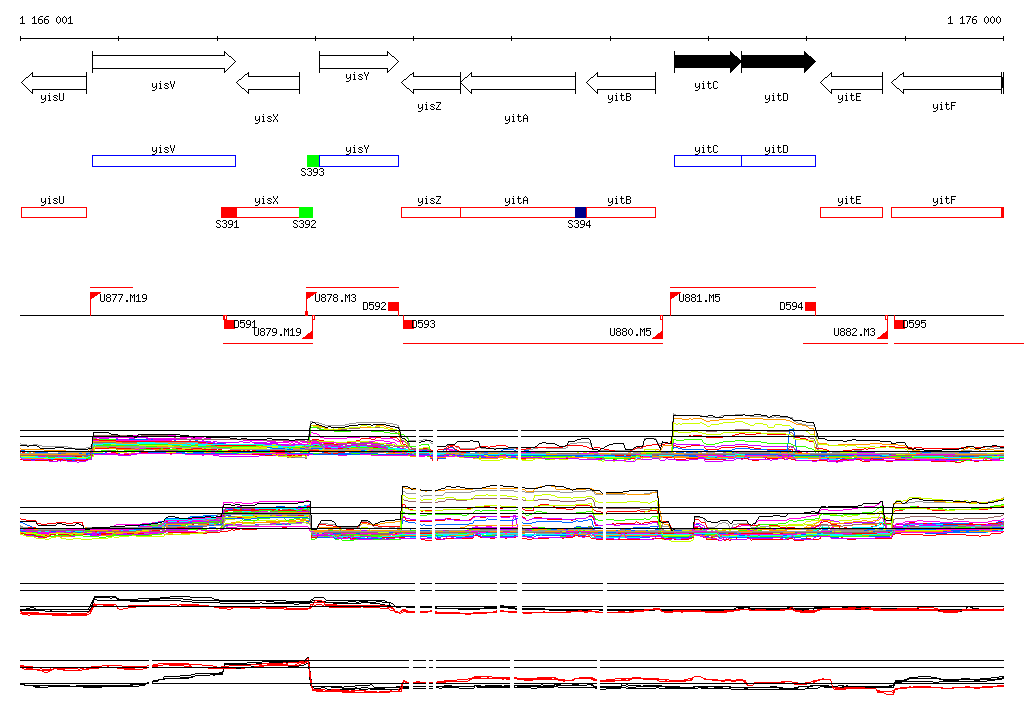
Genomic View of Gene/Segment yitA
Show/Hide
(Legend)
Browse Genome Context