| Start Page |
|
 |
| Start Page |
|
|
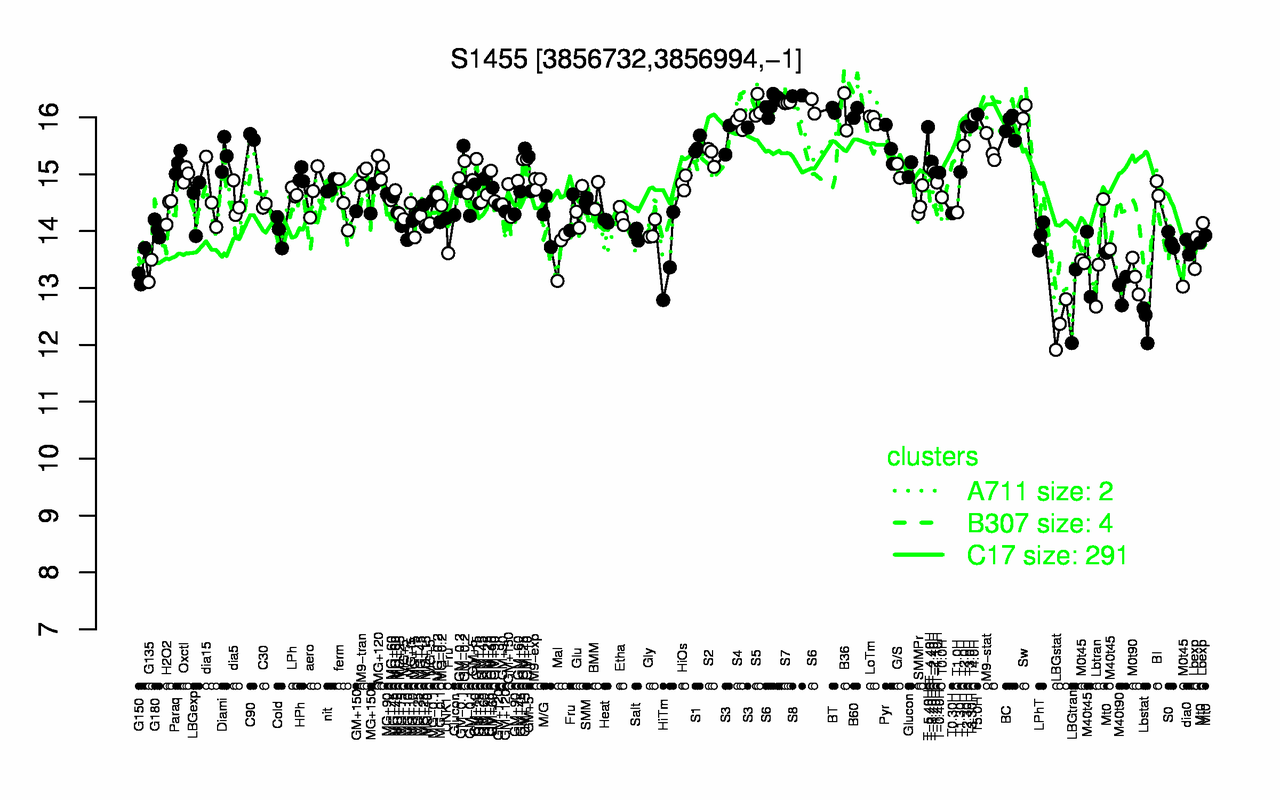
| S8 | S7 | S6 | S5 | BT | Sw | B36 | B60 | T5.0H | T4.0H |
| 16.4 | 16.3 | 16.2 | 16.2 | 16.1 | 16.1 | 16.1 | 16.1 | 16.1 | 16 |
| LBGstat | Lbstat | LBGtran | M40t90 | M0t90 | G135 | M0t45 | G150 | HiTm | M40t45 |
| 12.4 | 12.4 | 12.7 | 13 | 13.2 | 13.3 | 13.3 | 13.3 | 13.5 | 13.5 |