| Start Page |
|
 |
| Start Page |
|
|
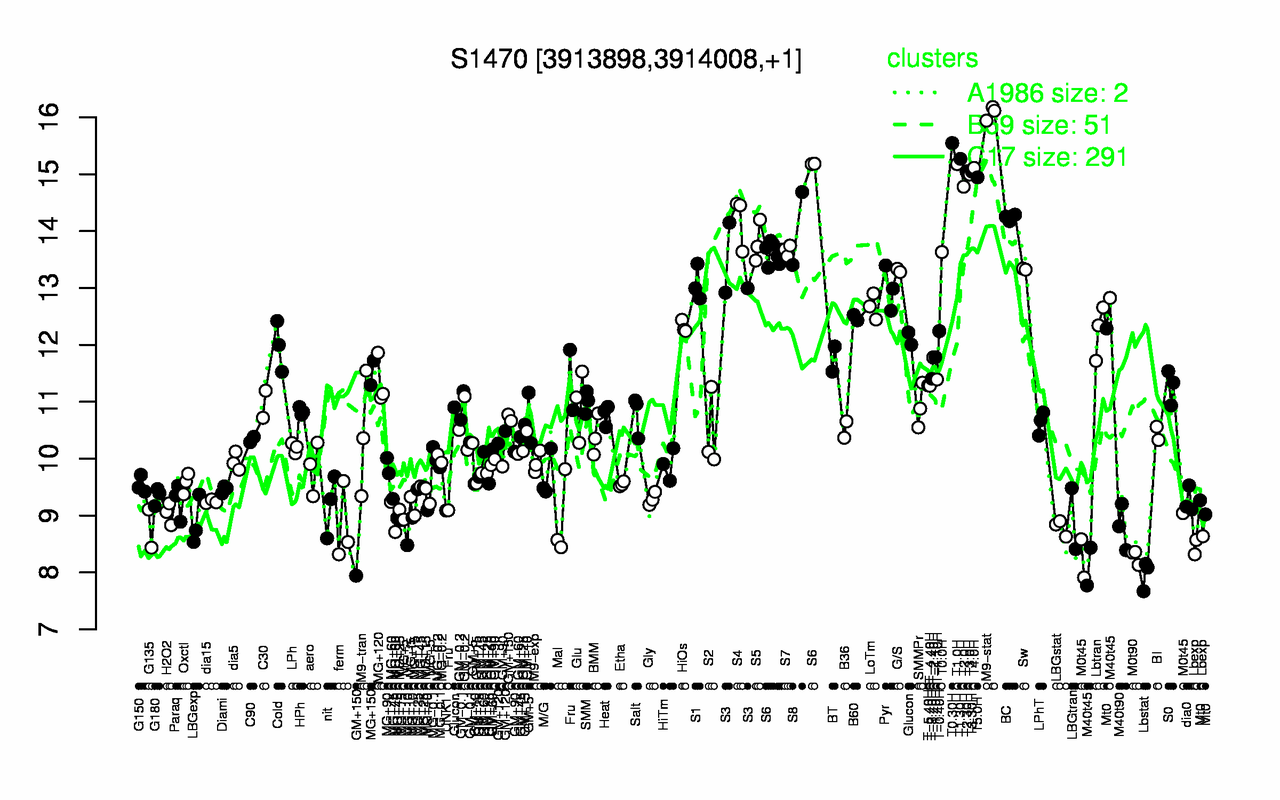
| M9-stat | T0.30H | T1.30H | T1.0H | T4.0H | T2.30H | T3.30H | T3.0H | T5.0H | T2.0H |
| 16.1 | 15.5 | 15.3 | 15.2 | 15.1 | 15 | 15 | 15 | 14.9 | 14.8 |
| Lbstat | M0t90 | Lbexp | M0t45 | G135 | LBGstat | M40t90 | ferm | MG+10 | LBGexp |
| 7.97 | 8.28 | 8.51 | 8.51 | 8.77 | 8.79 | 8.8 | 8.82 | 8.85 | 8.88 |