| Start Page |
|
 |
| Start Page |
|
|
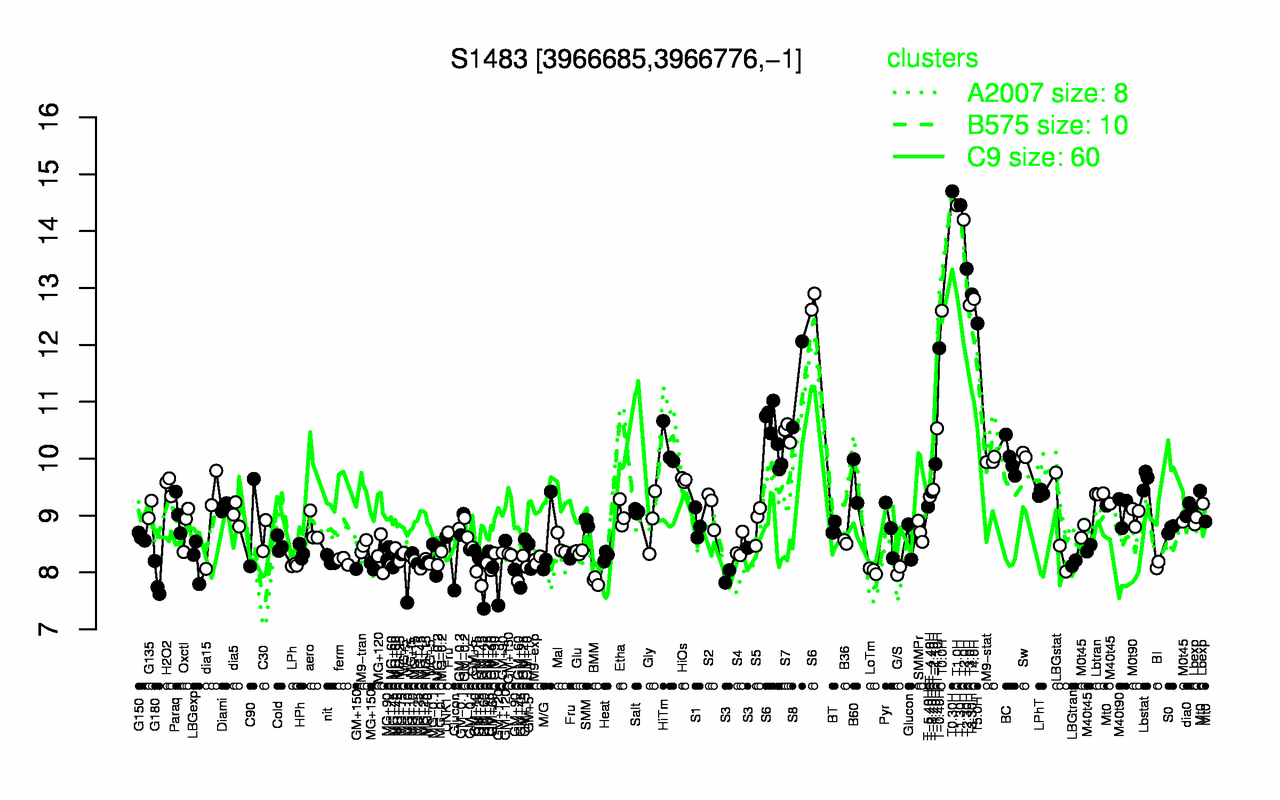
| T0.30H | T1.30H | T1.0H | T2.0H | T2.30H | T3.30H | T4.0H | T3.0H | T0.0H | T5.0H |
| 14.7 | 14.5 | 14.5 | 14.2 | 13.3 | 12.9 | 12.8 | 12.7 | 12.6 | 12.4 |
| GM+60 | GM+45 | BMM | G180 | GM+120 | MG+10 | G/S | LoTm | S3 | MG+150 |
| 7.77 | 7.85 | 7.85 | 7.86 | 7.99 | 8 | 8.03 | 8.03 | 8.1 | 8.11 |