B. subtilis Expression Data Browser
Details about tsf Show/Hide
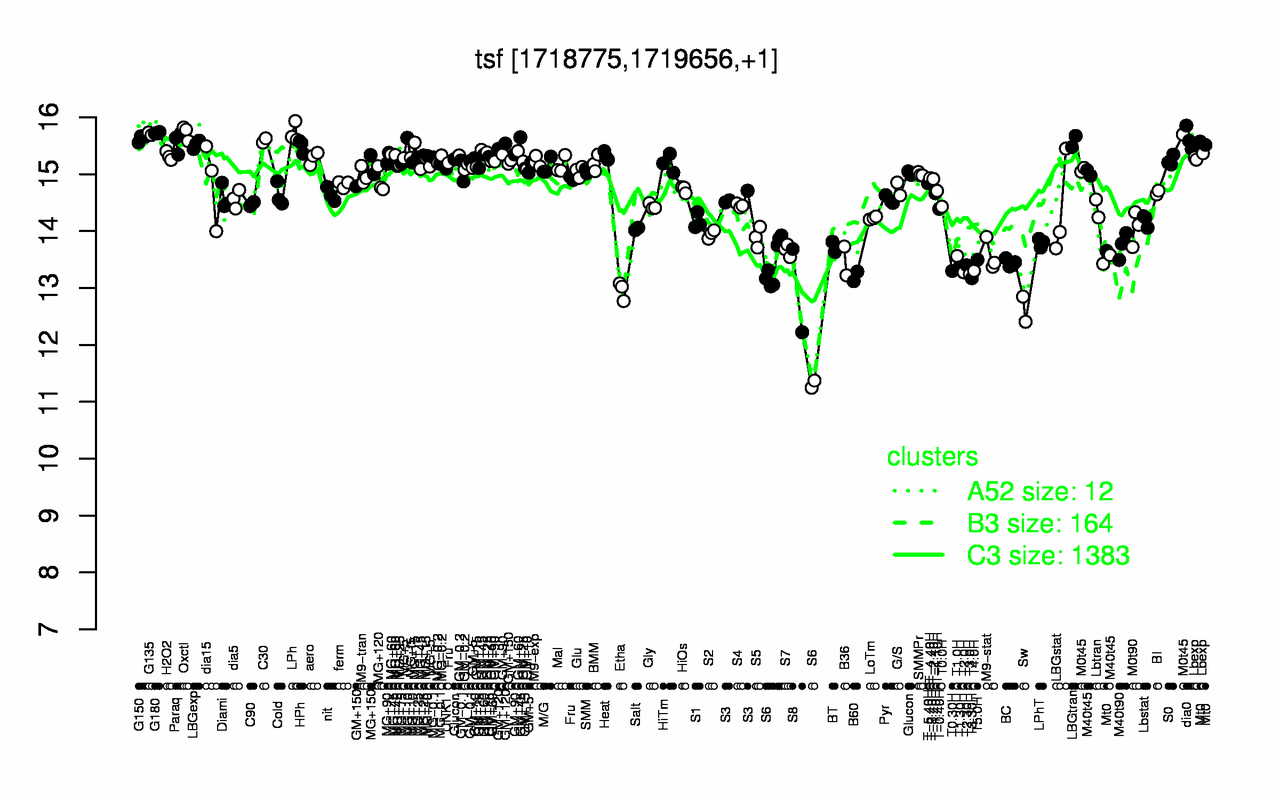
Highest Expression Conditions
LPh Oxctl G180 G135 dia0 G150 C30 LBGtran Paraq LBGexp
15.7 15.7 15.7 15.7 15.6 15.6 15.6 15.6 15.6 15.5
Lowest Expression Conditions
Sw S8 Etha S6 T3.30H B60 T3.0H T2.0H T0.30H T4.0H
12.6 13 13 13 13.2 13.2 13.2 13.3 13.3 13.3
Most Positively Correlated Segments
frr pyrH S587 murE rpsB tig S558 mraY murD gatA
0.96 0.96 0.95 0.92 0.9 0.9 0.89 0.88 0.88 0.87
Most Negatively Correlated Segments
ylbP gltP ggt spoIISB lcfA S727 S1087 ytvB abnA yugM
-0.79 -0.78 -0.78 -0.78 -0.78 -0.76 -0.76 -0.76 -0.76 -0.76
Expression Profile of Segment tsf Show/Hide
Annotation of Gene tsf Show/Hide
function
16.2: Construct biomass (Anabolism)
inference
ab initio prediction:AMIGene:2.0
codon_start
1
product
elongation factor Ts
transl_table
11
note
Evidence 2a: Function of homologous gene experimentally demonstrated in an other organism; PubMedId: 11985624, 12682299, 6396082, 9244380, 9973356; Product type f: factor
db_xref
GI:2634022
protein_id
CAB13523.1
Genomic View of Gene/Segment tsf Show/Hide
(Legend)