| Start Page |
|
 |
| Start Page |
|
|
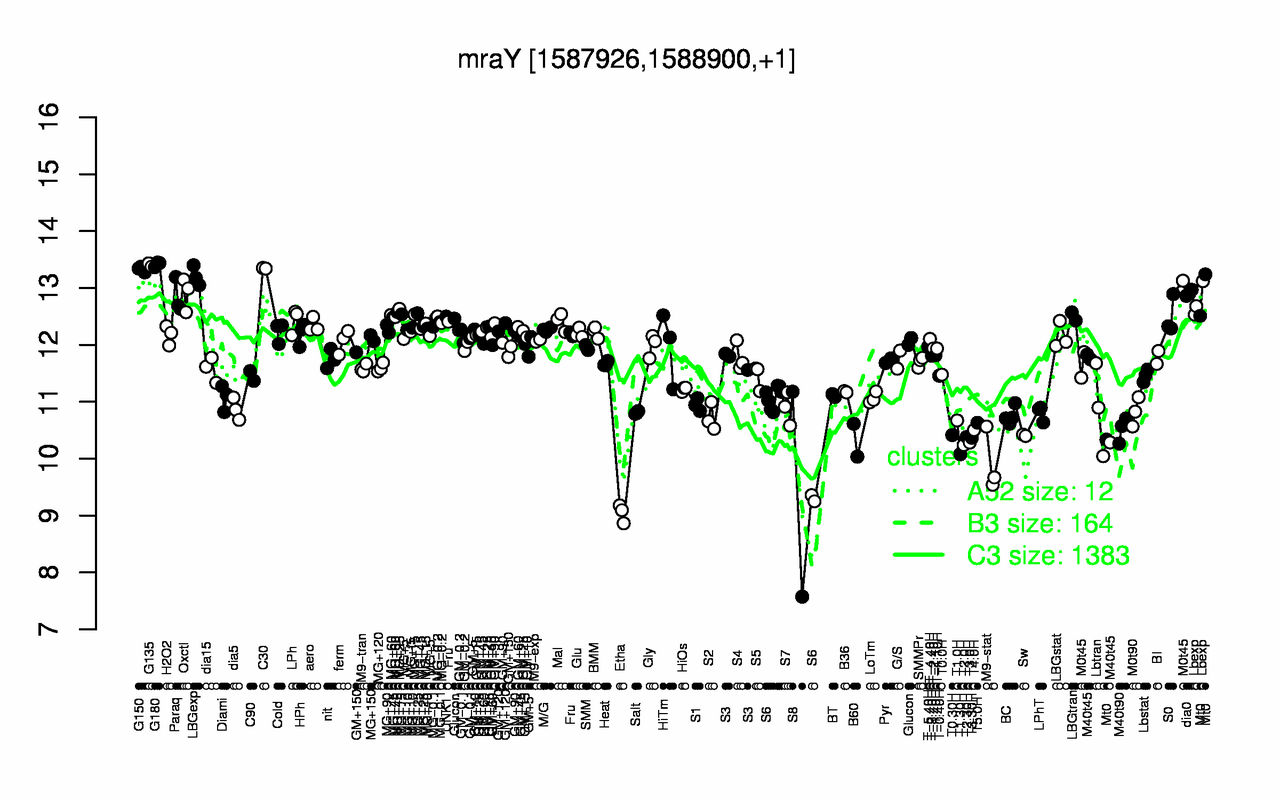
| G180 | G135 | C30 | G150 | LBGexp | dia0 | Oxctl | Paraq | Lbexp | MG+60 |
| 13.4 | 13.4 | 13.3 | 13.3 | 13.2 | 12.9 | 12.9 | 12.8 | 12.8 | 12.5 |
| Etha | S8 | M9-stat | T1.30H | T2.0H | T3.0H | B60 | T3.30H | T2.30H | Sw |
| 9.05 | 9.38 | 9.92 | 10.1 | 10.2 | 10.3 | 10.3 | 10.4 | 10.4 | 10.4 |