| Start Page |
|
 |
| Start Page |
|
|
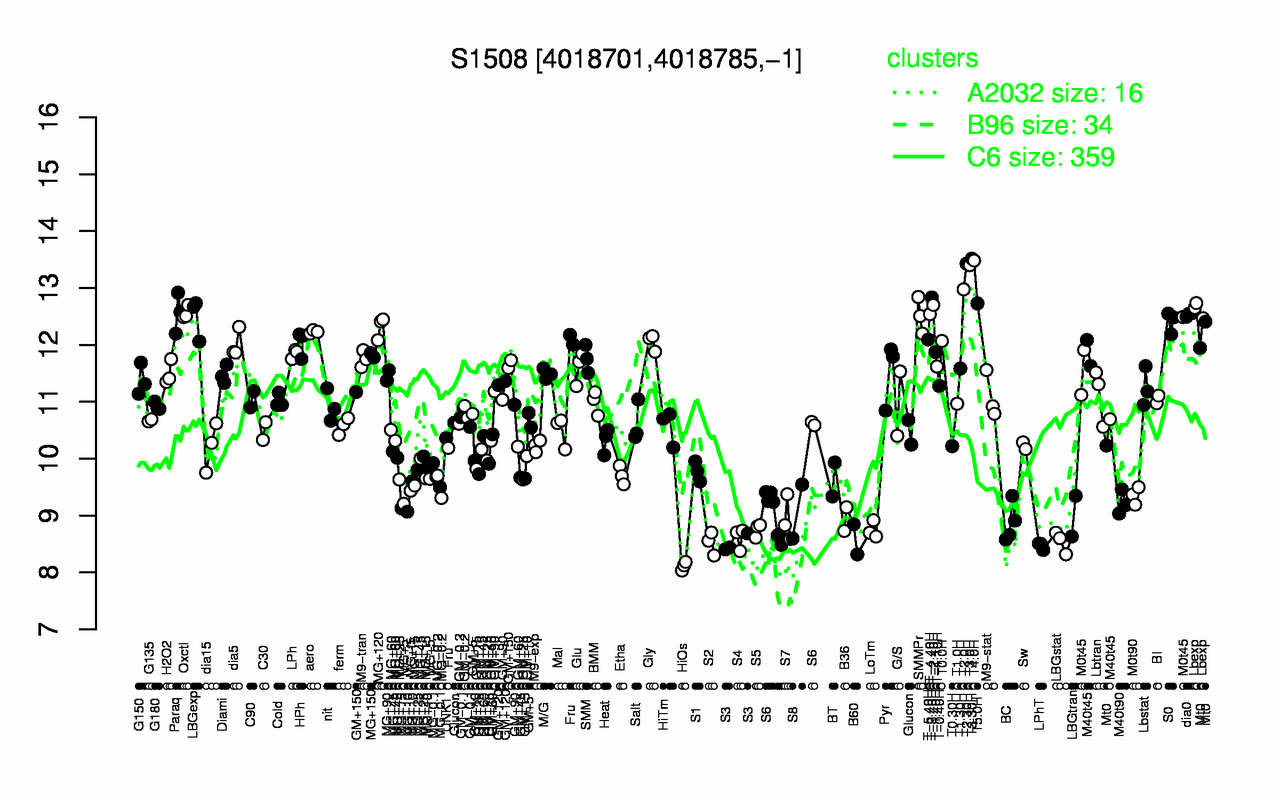
| T3.30H | T4.0H | T2.30H | T3.0H | T2.0H | T-3.40H | T5.0H | T-2.40H | Lbexp | Oxctl |
| 13.5 | 13.5 | 13.4 | 13.4 | 13 | 12.8 | 12.7 | 12.7 | 12.6 | 12.6 |
| HiOs | LPhT | S3 | S2 | LBGstat | B60 | S4 | LoTm | S5 | BC |
| 8.11 | 8.47 | 8.51 | 8.52 | 8.54 | 8.58 | 8.6 | 8.75 | 8.75 | 8.87 |