B. subtilis Expression Data Browser
Start Page
B. subtilis Expression Data Browser
Gene/Segment:
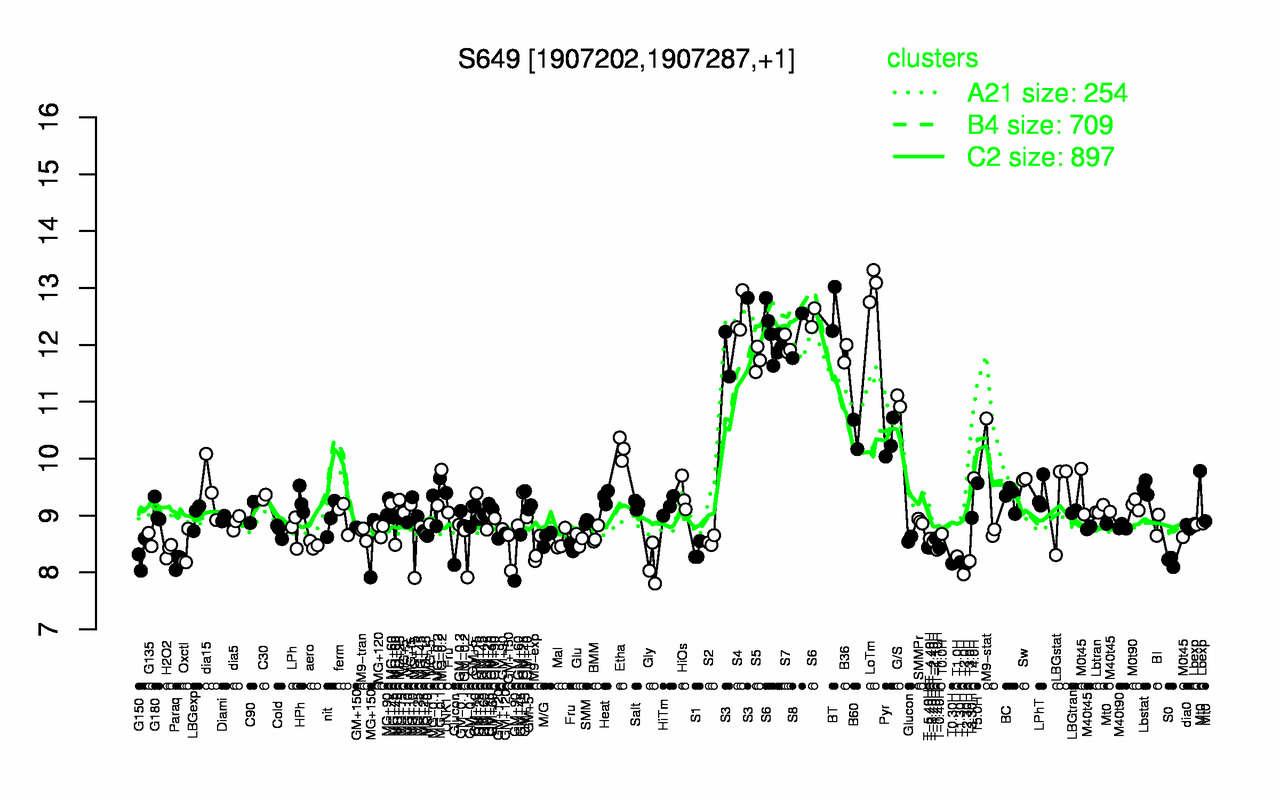
S649
Locus Tag:
new_1907202_1907287
Details about S649
Show/Hide
Highest Expression Conditions
LoTm
BT
S4
S6
S3
S8
S7
B36
S5
G/S
13.1
12.6
12.5
12.2
12.2
12.2
12
11.8
11.7
11
Lowest Expression Conditions
T2.0H
Gly
T0.30H
T2.30H
T1.30H
S0
Paraq
T3.0H
T1.0H
G150
7.97
8.12
8.15
8.16
8.19
8.19
8.19
8.2
8.28
8.32
Most Positively Correlated Segments
ynzB
S648
S1445
S369
yjcA
S1550
yqhO
S1062
yhbH
yutH
0.99
0.9
0.89
0.89
0.88
0.88
0.88
0.88
0.88
0.88
Most Negatively Correlated Segments
yugH
kinC
addA
yugG
sbcC
S1406
addB
sbcD
S378
yceG
-0.83
-0.81
-0.8
-0.8
-0.8
-0.79
-0.79
-0.79
-0.79
-0.79
Expression Profile of Segment S649
Show/Hide
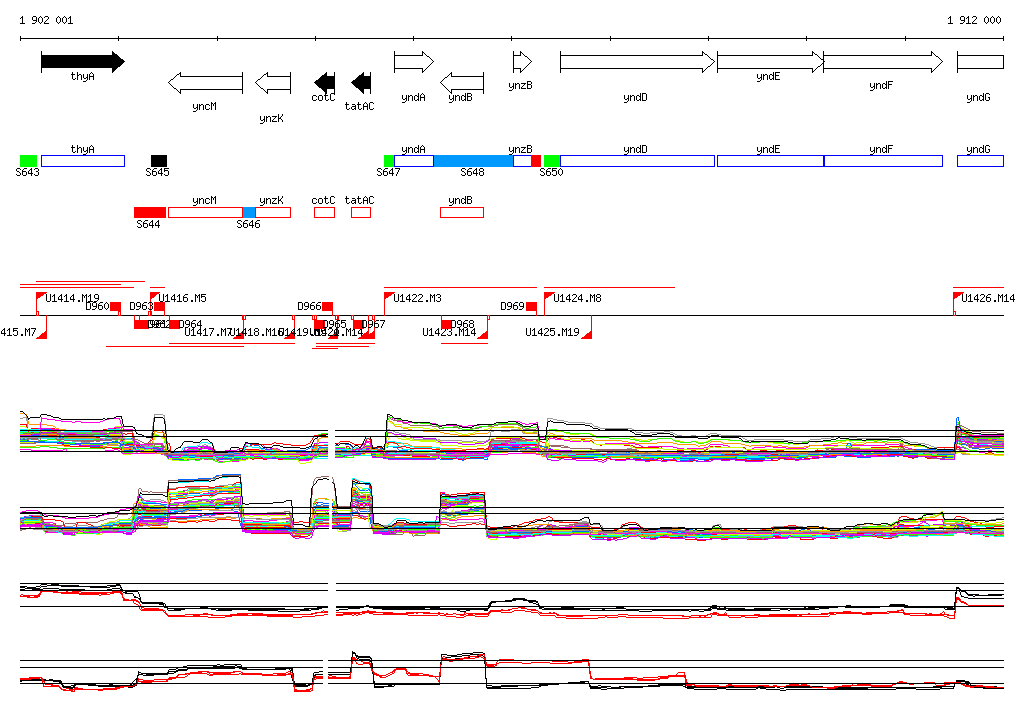
Genomic View of Gene/Segment S649
Show/Hide
(Legend)
Browse Genome Context