| Start Page |
|
 |
| Start Page |
|
|
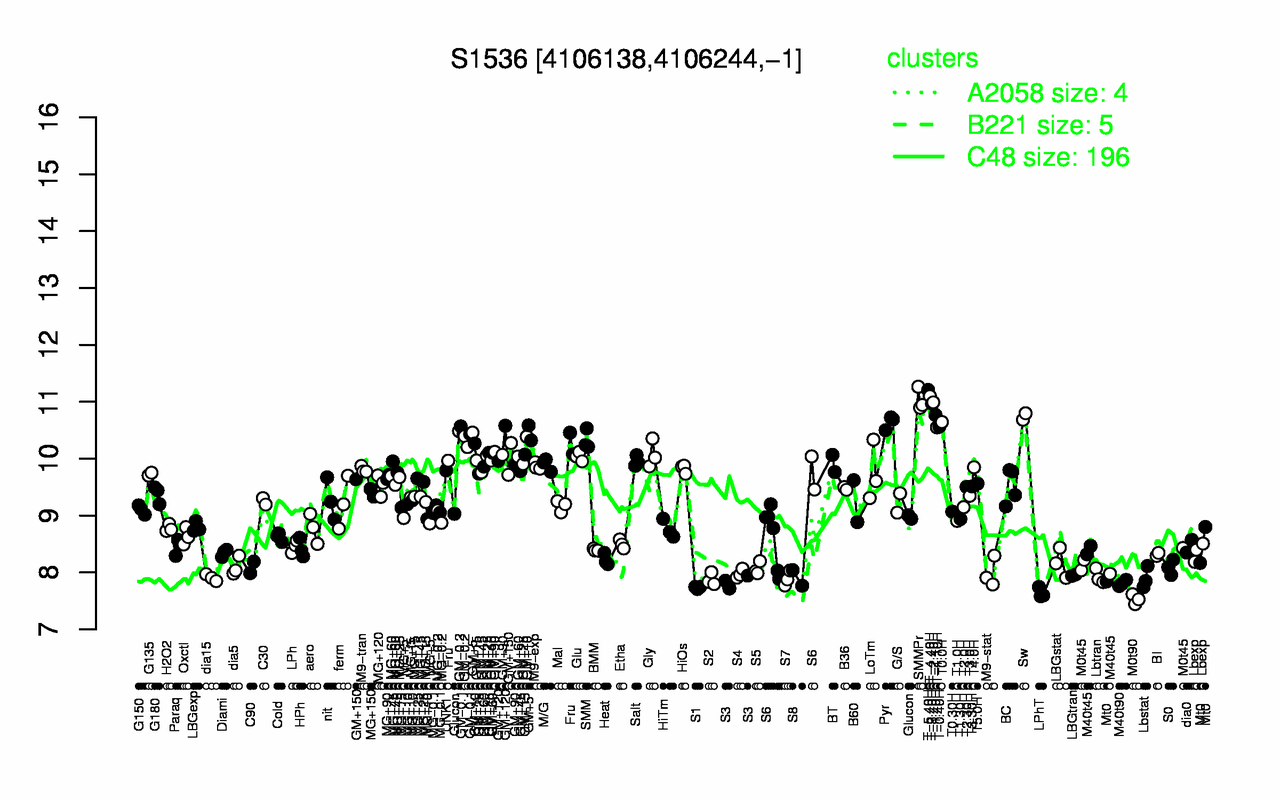
| T-5.40H | T-4.40H | SMMPr | T-2.40H | T-3.40H | T-1.40H | Sw | T0.0H | Pyr | T-0.40H |
| 11.2 | 11.1 | 11 | 11 | 11 | 10.8 | 10.7 | 10.6 | 10.6 | 10.6 |
| M0t90 | LPhT | S1 | M40t90 | S3 | S2 | S7 | Lbstat | S8 | dia15 |
| 7.53 | 7.64 | 7.73 | 7.81 | 7.84 | 7.88 | 7.89 | 7.9 | 7.9 | 7.91 |