| Start Page |
|
 |
| Start Page |
|
|
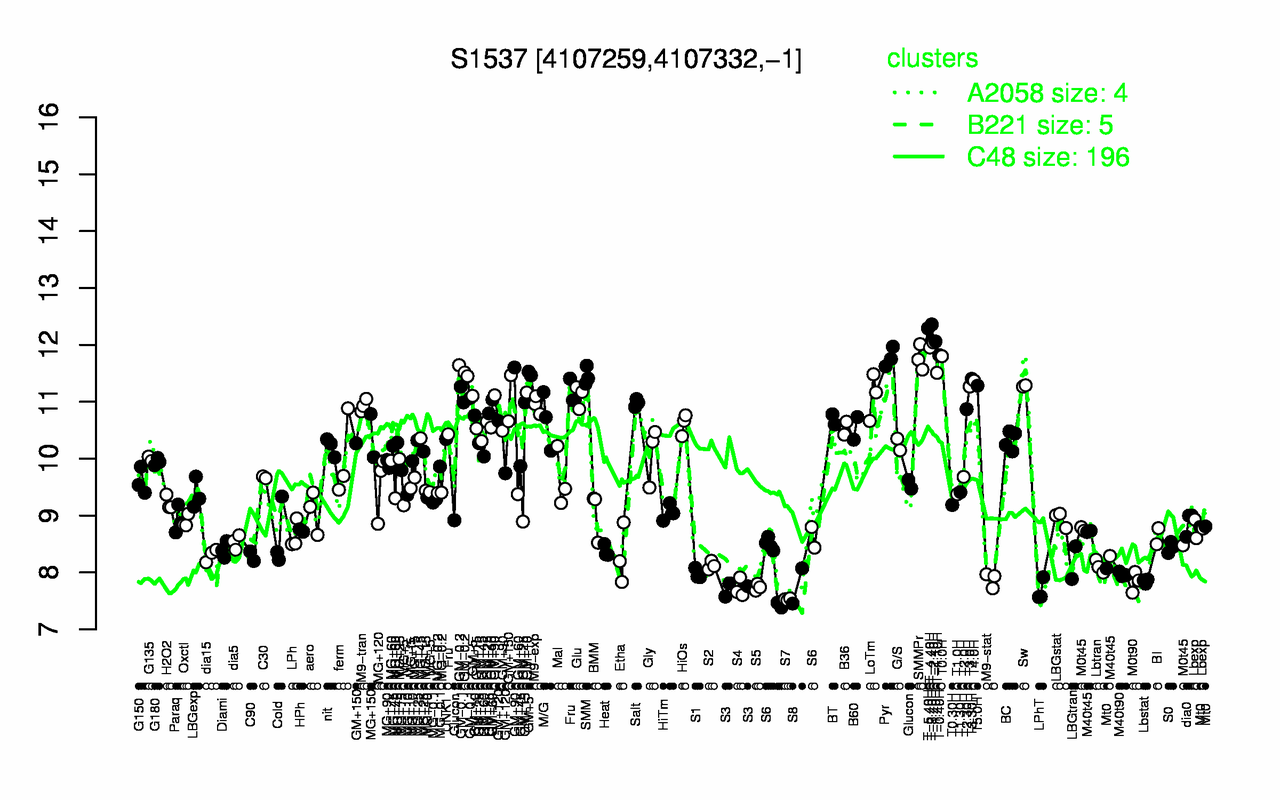
| T-3.40H | T-5.40H | T-1.40H | T-2.40H | T-4.40H | T-0.40H | T0.0H | Pyr | SMMPr | GM-0.2 |
| 12.4 | 12.3 | 12.1 | 12 | 12 | 11.8 | 11.8 | 11.8 | 11.8 | 11.5 |
| S7 | LPhT | S3 | S4 | S5 | S8 | M0t90 | Lbstat | M9-stat | M40t90 |
| 7.53 | 7.69 | 7.71 | 7.72 | 7.74 | 7.76 | 7.84 | 7.85 | 7.87 | 7.97 |