B. subtilis Expression Data Browser
Start Page
B. subtilis Expression Data Browser
Gene/Segment:
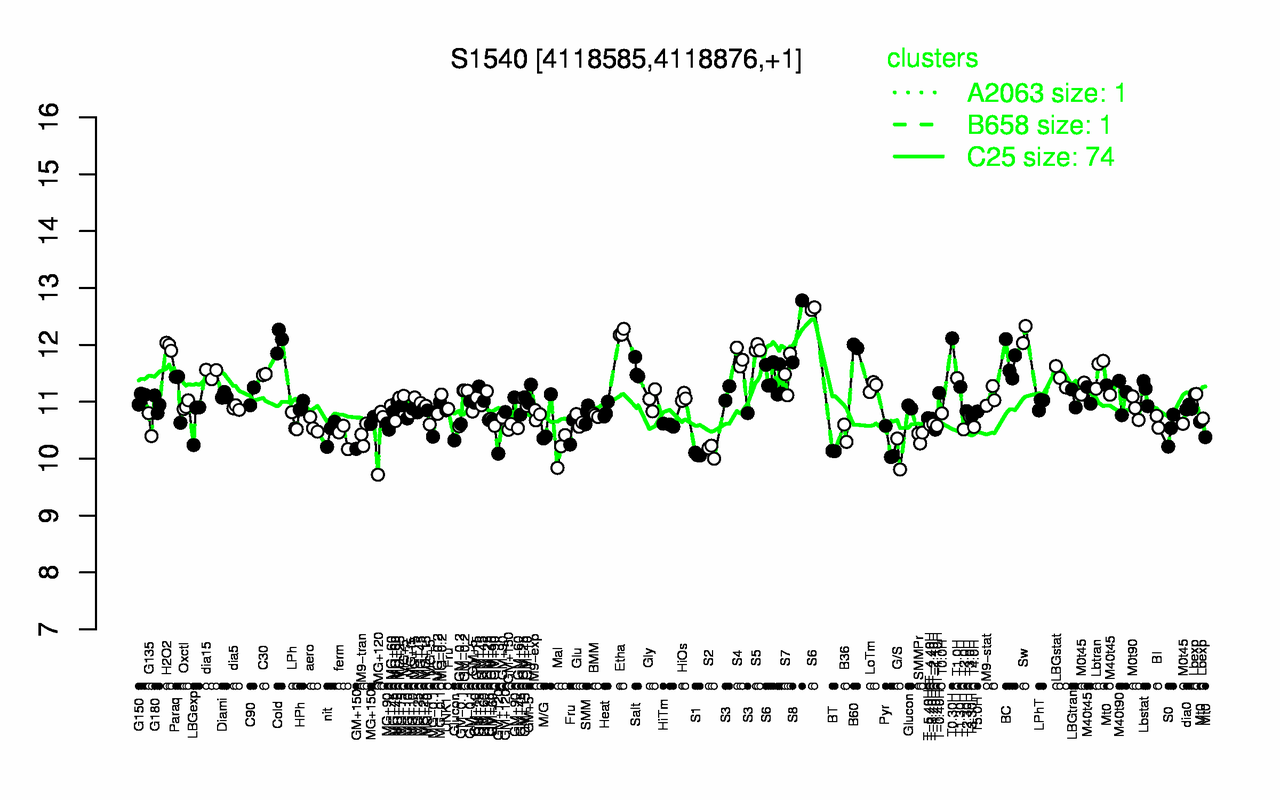
S1540
Locus Tag:
new_4118585_4118876
Details about S1540
Show/Hide
Highest Expression Conditions
S8
Etha
Sw
T0.30H
Cold
H2O2
B60
S5
S4
BC
12.2
12.2
12.2
12.1
12.1
12
12
11.9
11.8
11.7
Lowest Expression Conditions
S1
G/S
BT
S2
Mal
Pyr
SMMPr
ferm
M9-tran
MG+120
10.1
10.1
10.1
10.1
10.2
10.2
10.4
10.4
10.4
10.4
Most Positively Correlated Segments
yckC
spoIISA
ywmA
yfhP
ypuC
ypuC
S293
yizA
yyaO
S463
0.61
0.6
0.59
0.59
0.58
0.58
0.58
0.57
0.57
0.56
Most Negatively Correlated Segments
yvrP
yvrO
yqkA
yueB
yvrN
yukB
atpH
atpA
aroF
S1565
-0.61
-0.61
-0.61
-0.59
-0.59
-0.58
-0.58
-0.58
-0.58
-0.58
Expression Profile of Segment S1540
Show/Hide
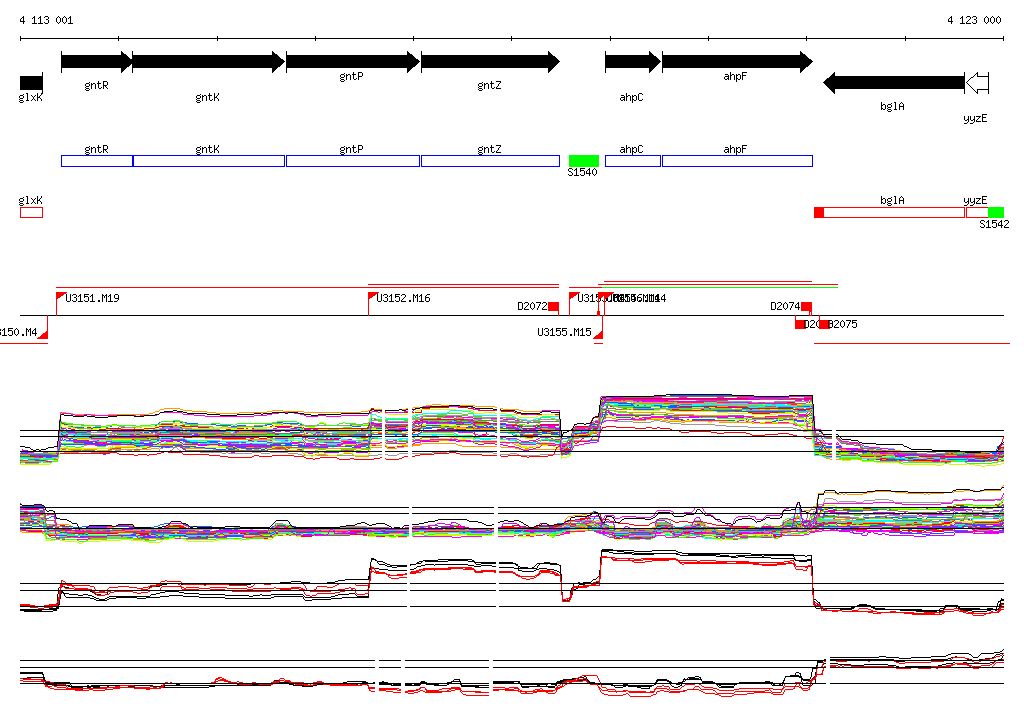
Genomic View of Gene/Segment S1540
Show/Hide
(Legend)
Browse Genome Context