| Start Page |
|
 |
| Start Page |
|
|
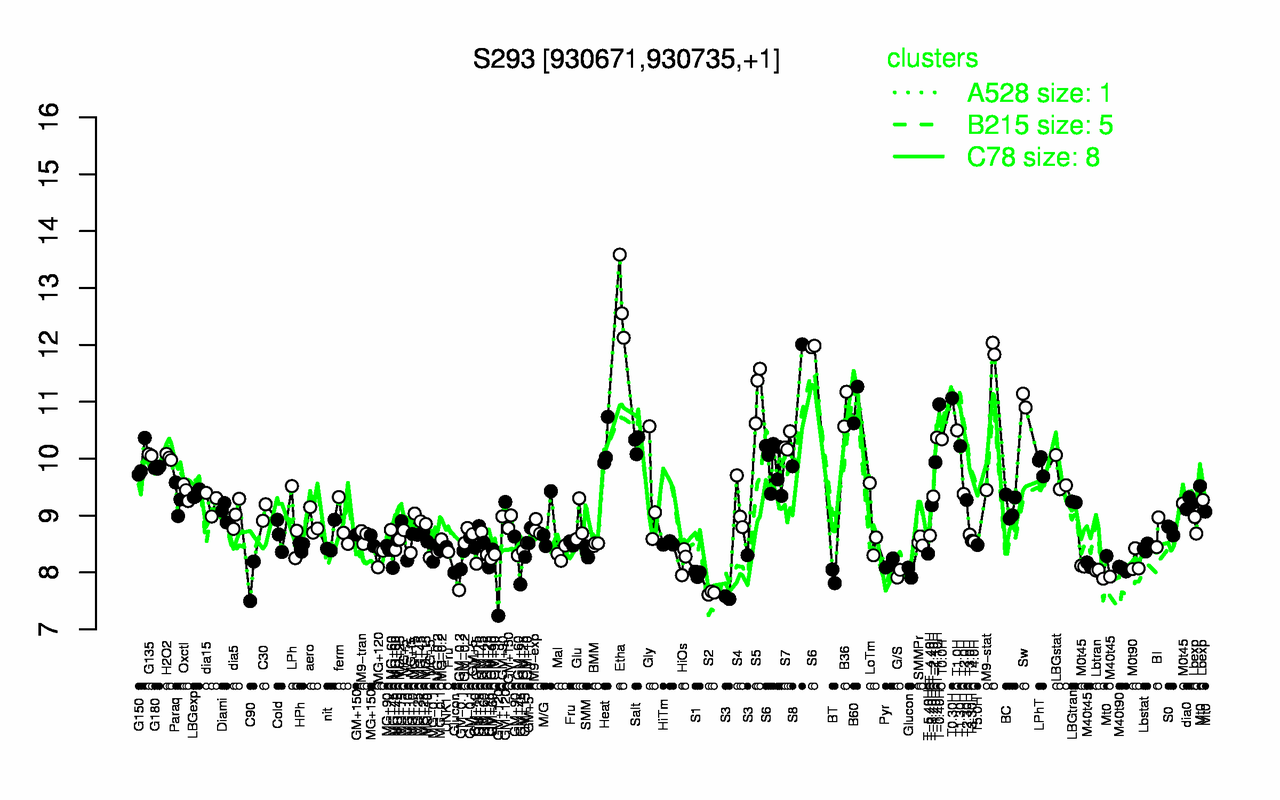
| Etha | S5 | M9-stat | T0.30H | Sw | T-0.40H | B60 | S8 | B36 | T1.0H |
| 12.8 | 11.2 | 11.1 | 11.1 | 11 | 11 | 10.9 | 10.9 | 10.9 | 10.5 |
| S2 | S3 | C90 | BT | G/S | S1 | Lbtran | Glucon | M40t90 | M40t45 |
| 7.64 | 7.81 | 7.84 | 7.93 | 7.98 | 7.98 | 7.99 | 8 | 8.06 | 8.07 |