| Start Page |
|
 |
| Start Page |
|
|
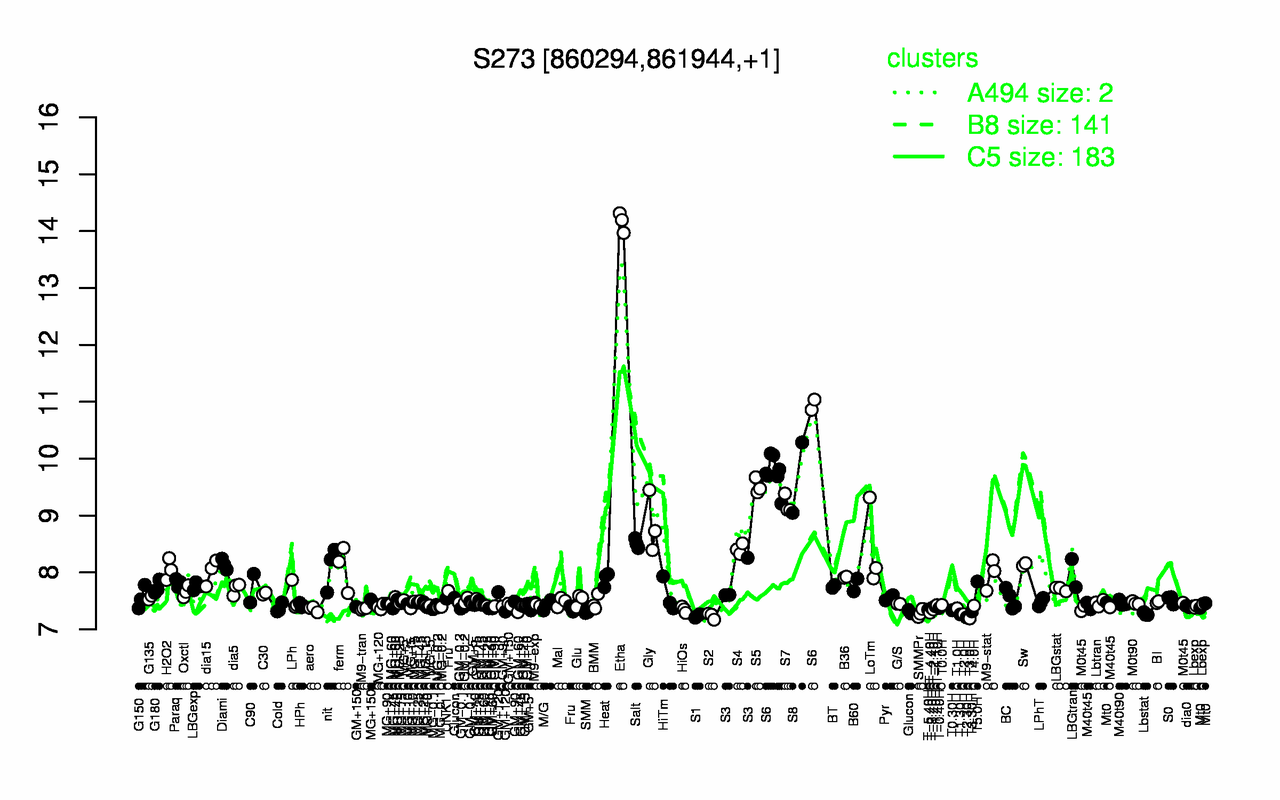
| Etha | S6 | S8 | S5 | S7 | Gly | Salt | LoTm | S4 | Diami |
| 14.2 | 10 | 9.67 | 9.52 | 9.2 | 8.86 | 8.51 | 8.43 | 8.41 | 8.14 |
| T3.0H | T2.30H | S2 | S1 | T1.30H | T2.0H | Lbstat | SMMPr | T-4.40H | T3.30H |
| 7.19 | 7.21 | 7.23 | 7.24 | 7.27 | 7.27 | 7.27 | 7.28 | 7.29 | 7.31 |