B. subtilis Expression Data Browser
Details about S1556 Show/Hide
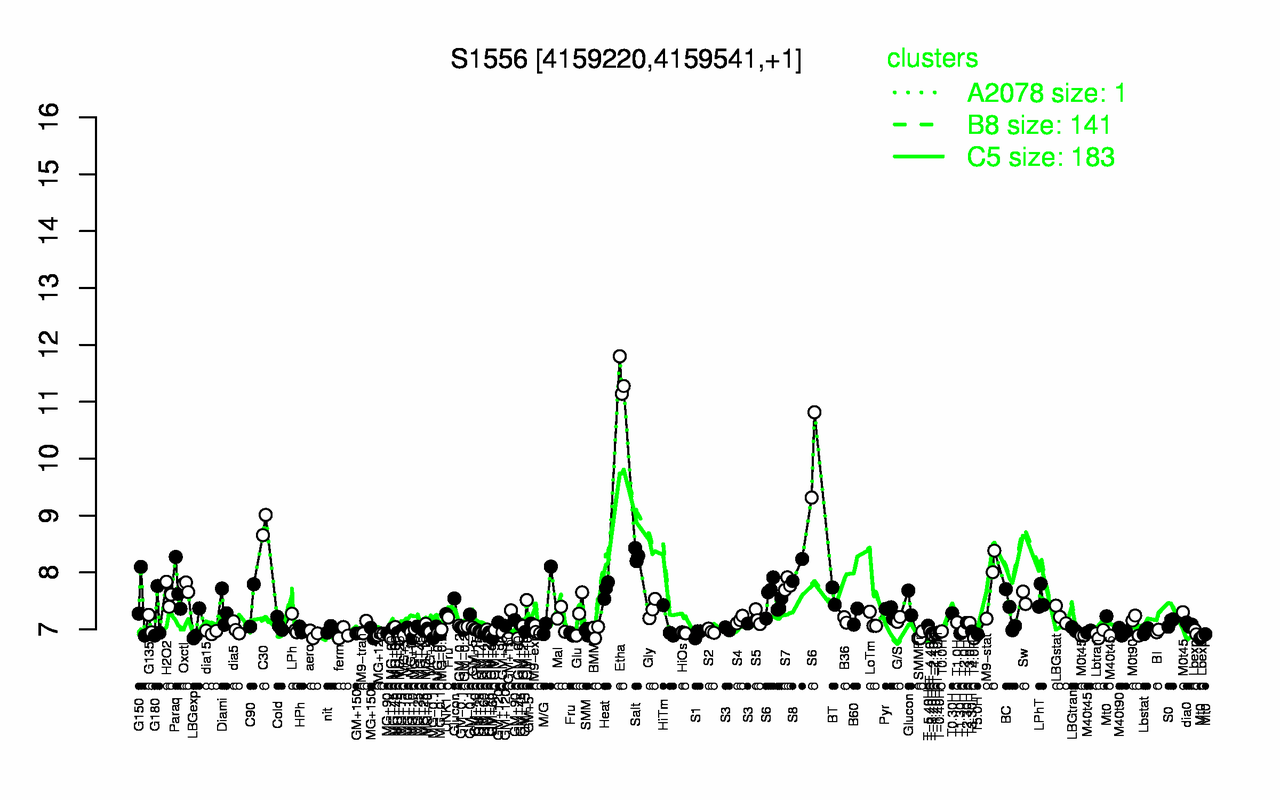
Highest Expression Conditions
Etha C30 Salt S6 S8 M9-stat S7 Oxctl Paraq Heat
11.4 8.83 8.31 8.09 8.04 7.86 7.79 7.76 7.75 7.7
Lowest Expression Conditions
T4.0H GM+60 SMMPr T-2.40H MG+120 T5.0H aero Lbtran MG+5 ferm
6.84 6.87 6.88 6.89 6.91 6.91 6.92 6.92 6.92 6.92
Most Positively Correlated Segments
S446 S1378 S273 yqbM S1417 S148 yxkA yflD S269 S970
0.82 0.81 0.8 0.78 0.76 0.76 0.75 0.74 0.74 0.74
Most Negatively Correlated Segments
atpE atpH atpF atpA atpG rpsG rpsL atpB murAB S1424
-0.68 -0.68 -0.67 -0.67 -0.66 -0.65 -0.65 -0.65 -0.64 -0.64
Expression Profile of Segment S1556 Show/Hide
Genomic View of Gene/Segment S1556 Show/Hide
(Legend)