| Start Page |
|
 |
| Start Page |
|
|
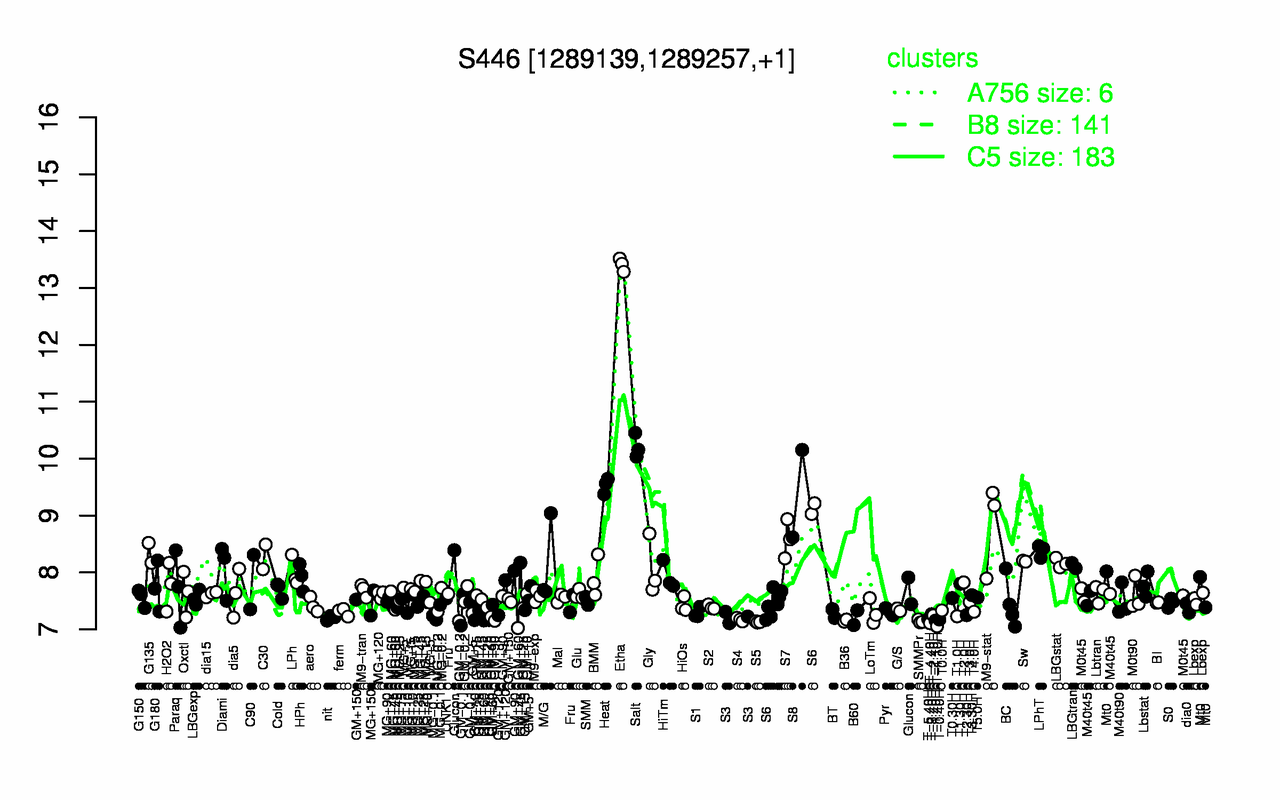
| Etha | Salt | Heat | S8 | M9-stat | S7 | LPhT | G135 | C30 | Sw |
| 13.4 | 10.2 | 9.53 | 9.38 | 8.82 | 8.59 | 8.38 | 8.34 | 8.27 | 8.2 |
| T-1.10H | T-4.40H | S5 | SMMPr | B36 | T-1.40H | T-0.40H | S4 | T-5.40H | nit |
| 7.05 | 7.11 | 7.13 | 7.14 | 7.15 | 7.16 | 7.17 | 7.17 | 7.18 | 7.2 |