| Start Page |
|
 |
| Start Page |
|
|
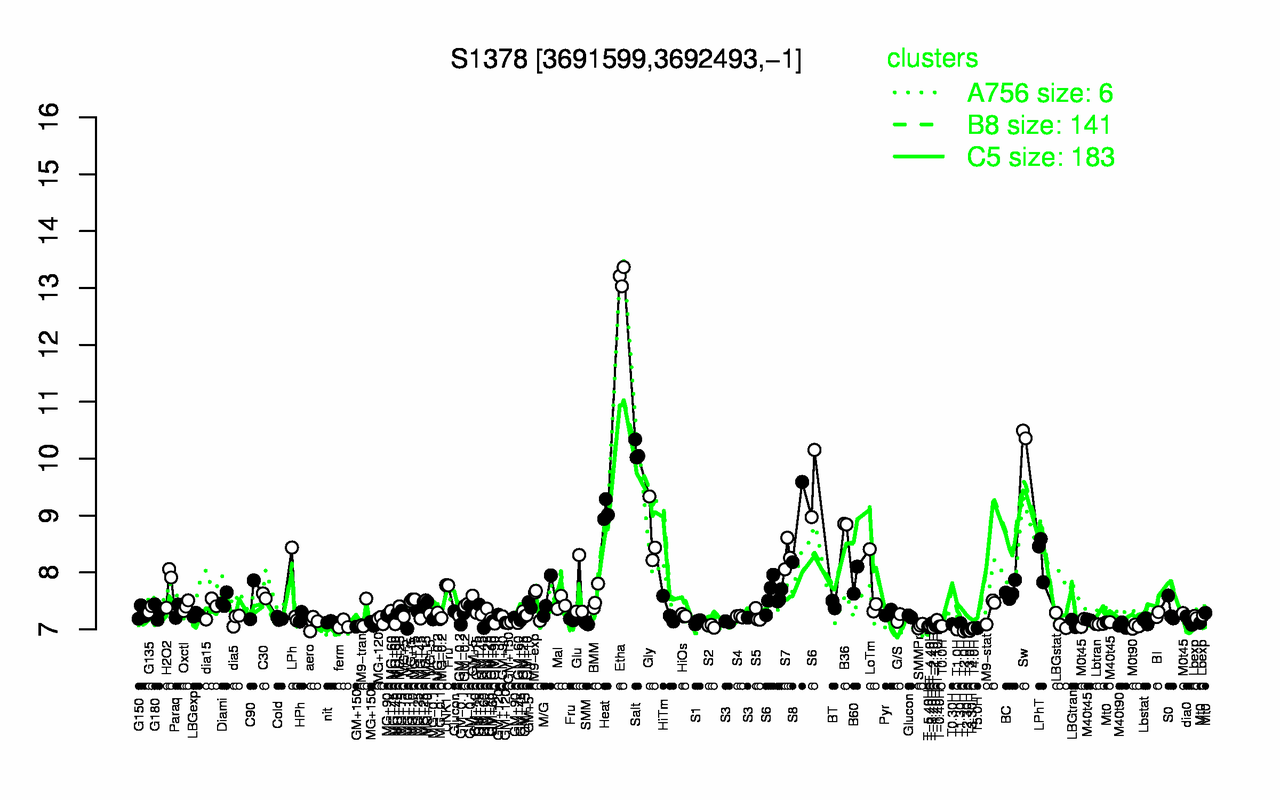
| Etha | Sw | Salt | Heat | S8 | B36 | Gly | S7 | LPhT | S6 |
| 13.2 | 10.4 | 10.1 | 9.08 | 8.89 | 8.85 | 8.66 | 8.31 | 8.29 | 8.03 |
| T2.0H | T3.0H | T2.30H | T1.0H | T3.30H | T5.0H | T4.0H | T-2.40H | M0t90 | T-5.40H |
| 6.97 | 6.97 | 6.99 | 7 | 7.01 | 7.02 | 7.02 | 7.03 | 7.05 | 7.05 |