| Start Page |
|
 |
| Start Page |
|
|
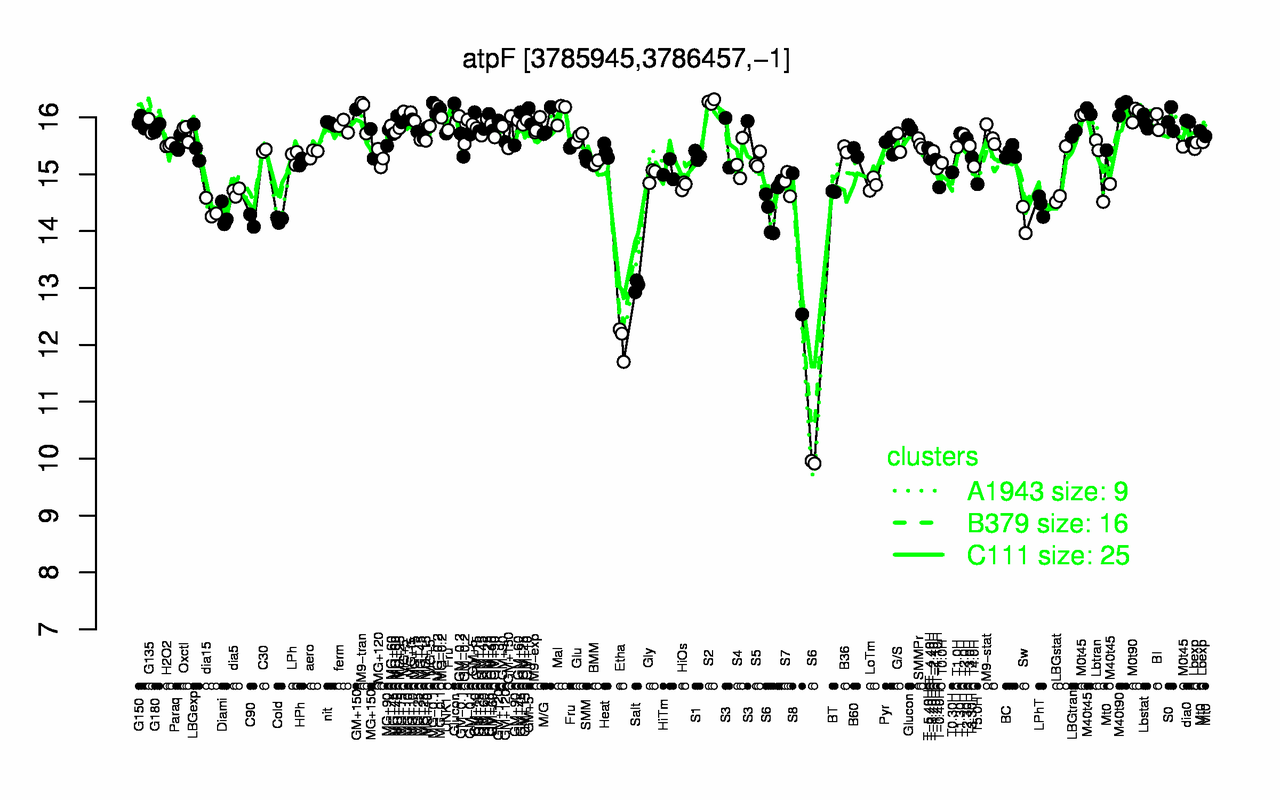
| S2 | M40t90 | MG-0.1 | MG-0.2 | MG+t5 | Mal | M9-tran | M0t90 | GM+10 | MG+5 |
| 16.3 | 16.2 | 16.2 | 16.1 | 16.1 | 16.1 | 16.1 | 16.1 | 16 | 16 |
| Etha | Salt | S6 | S8 | C90 | Sw | Cold | Diami | dia15 | LPhT |
| 12.1 | 13 | 13.5 | 13.8 | 14.2 | 14.2 | 14.2 | 14.3 | 14.4 | 14.4 |