| Start Page |
|
 |
| Start Page |
|
|
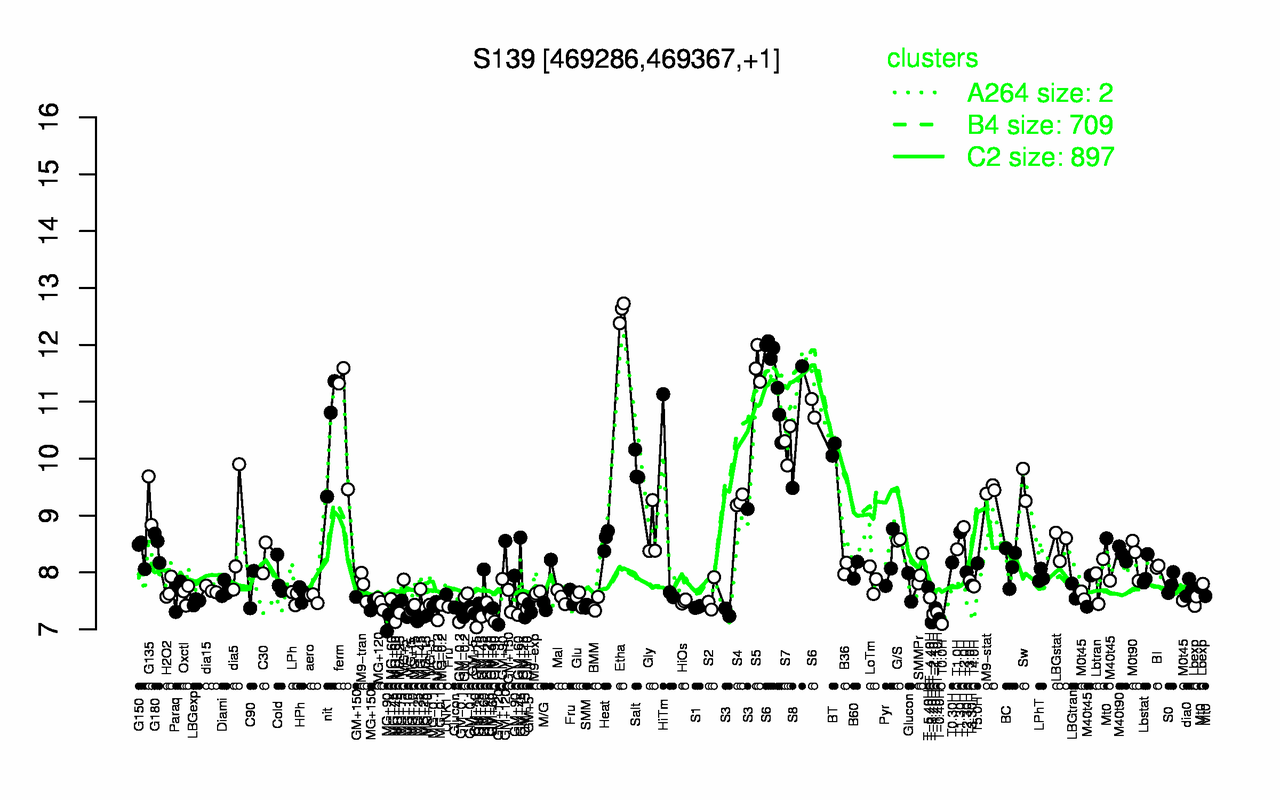
| Etha | S5 | S6 | ferm | S8 | nit | S7 | BT | Salt | Sw |
| 12.6 | 11.6 | 11.3 | 10.8 | 10.6 | 10.5 | 10.3 | 10.2 | 9.84 | 9.54 |
| T0.0H | MG+90 | T-3.40H | T-0.40H | GM+15 | MG+25 | T-2.40H | MG+10 | MG-0.2 | T-1.10H |
| 7.1 | 7.11 | 7.12 | 7.19 | 7.19 | 7.22 | 7.27 | 7.27 | 7.3 | 7.3 |