| Start Page |
|
 |
| Start Page |
|
|
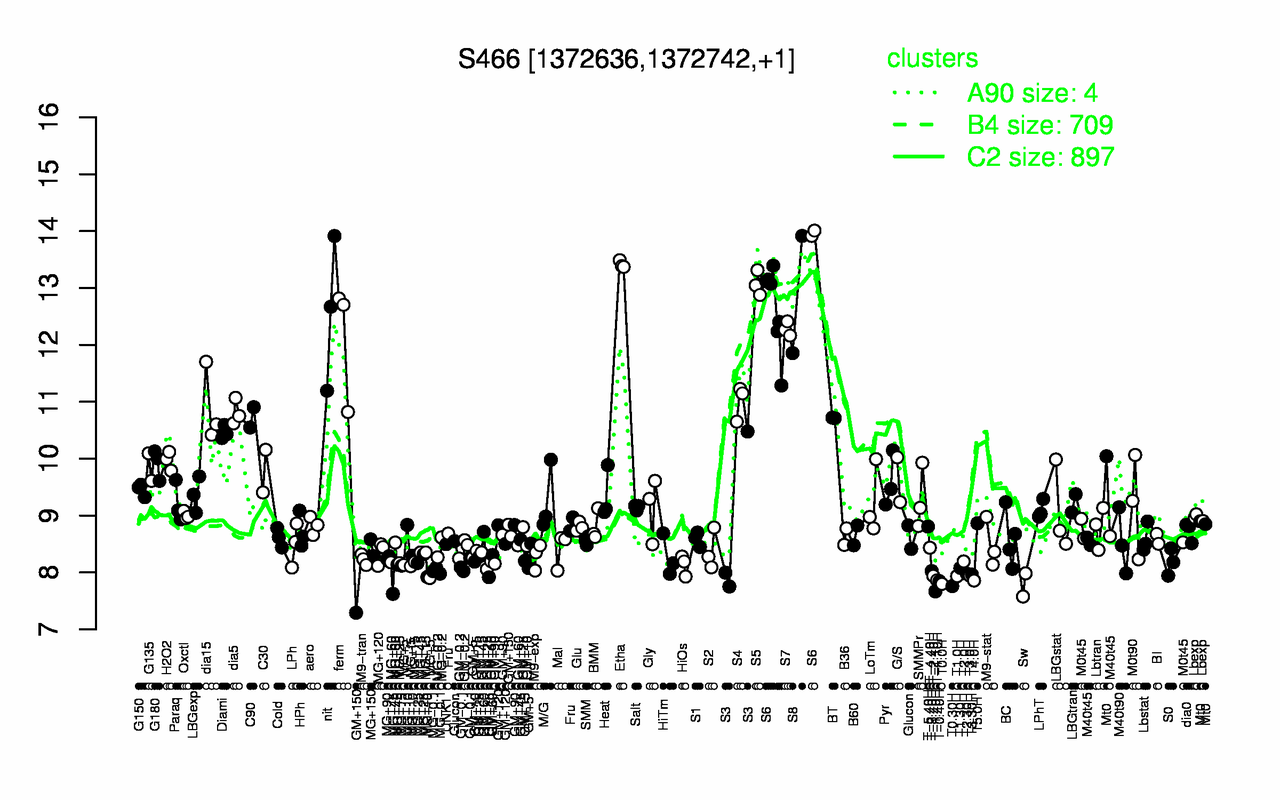
| Etha | S5 | S6 | S8 | nit | S7 | ferm | S4 | dia15 | dia5 |
| 13.4 | 13.1 | 13 | 12.9 | 12.6 | 12.3 | 12.1 | 11 | 10.9 | 10.8 |
| T-1.40H | T0.30H | Sw | T0.0H | T-0.40H | T4.0H | T-1.10H | T1.0H | T-2.40H | T3.0H |
| 7.67 | 7.76 | 7.78 | 7.8 | 7.85 | 7.86 | 7.86 | 7.93 | 7.94 | 7.95 |