| Start Page |
|
 |
| Start Page |
|
|
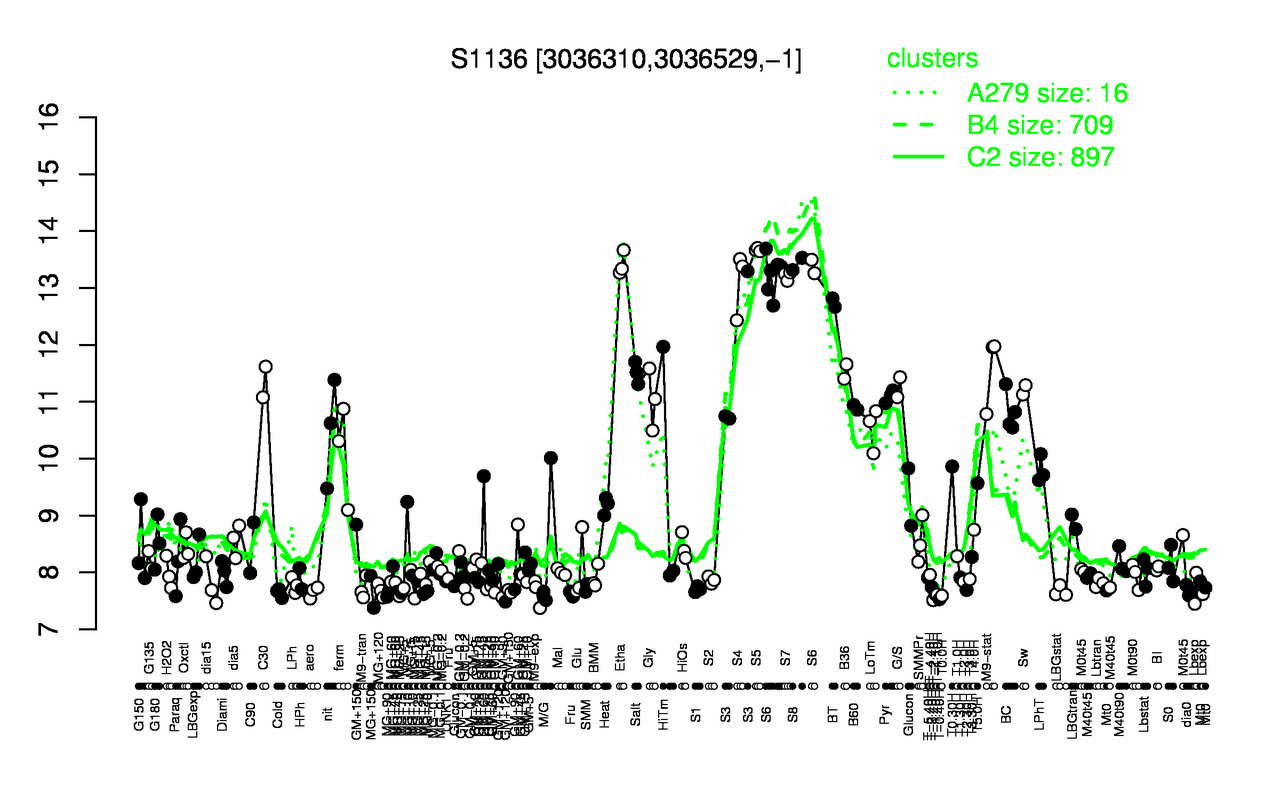
| S5 | Etha | S8 | S6 | S7 | S4 | BT | S3 | M9-stat | B36 |
| 13.7 | 13.4 | 13.4 | 13.3 | 13.2 | 13.1 | 12.7 | 11.6 | 11.6 | 11.5 |
| T-2.40H | T-0.40H | T0.0H | T-1.10H | T-1.40H | MG+90 | GM+90 | Cold | M9-exp | aero |
| 7.51 | 7.53 | 7.59 | 7.61 | 7.61 | 7.63 | 7.64 | 7.64 | 7.66 | 7.66 |