| Start Page |
|
 |
| Start Page |
|
|
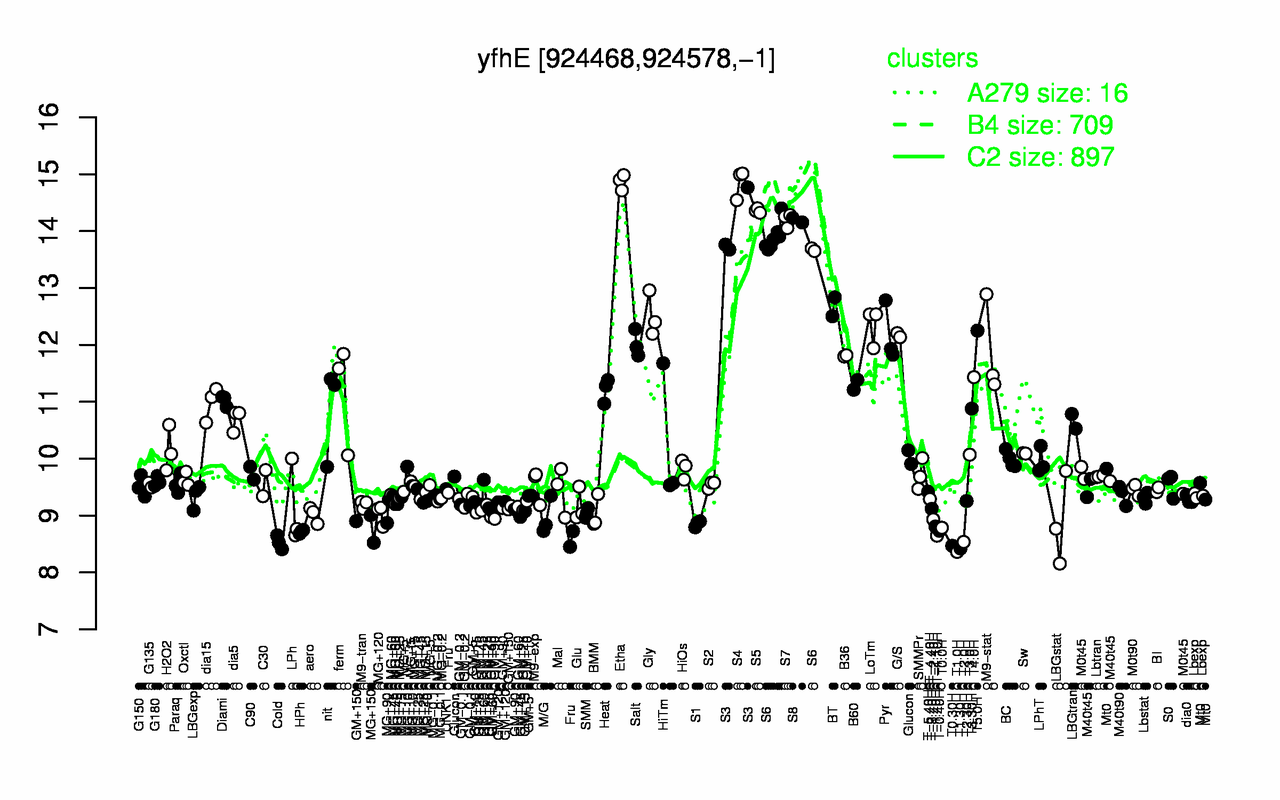
| Etha | S4 | S5 | S7 | S8 | S3 | S6 | BT | Gly | LoTm |
| 14.9 | 14.8 | 14.4 | 14.2 | 14.2 | 14.1 | 13.8 | 12.7 | 12.5 | 12.3 |
| T1.0H | T1.30H | T0.30H | Cold | T2.0H | T-1.10H | HPh | T-0.40H | MG+150 | T0.0H |
| 8.36 | 8.42 | 8.47 | 8.53 | 8.54 | 8.65 | 8.72 | 8.73 | 8.77 | 8.78 |