| Start Page |
|
 |
| Start Page |
|
|
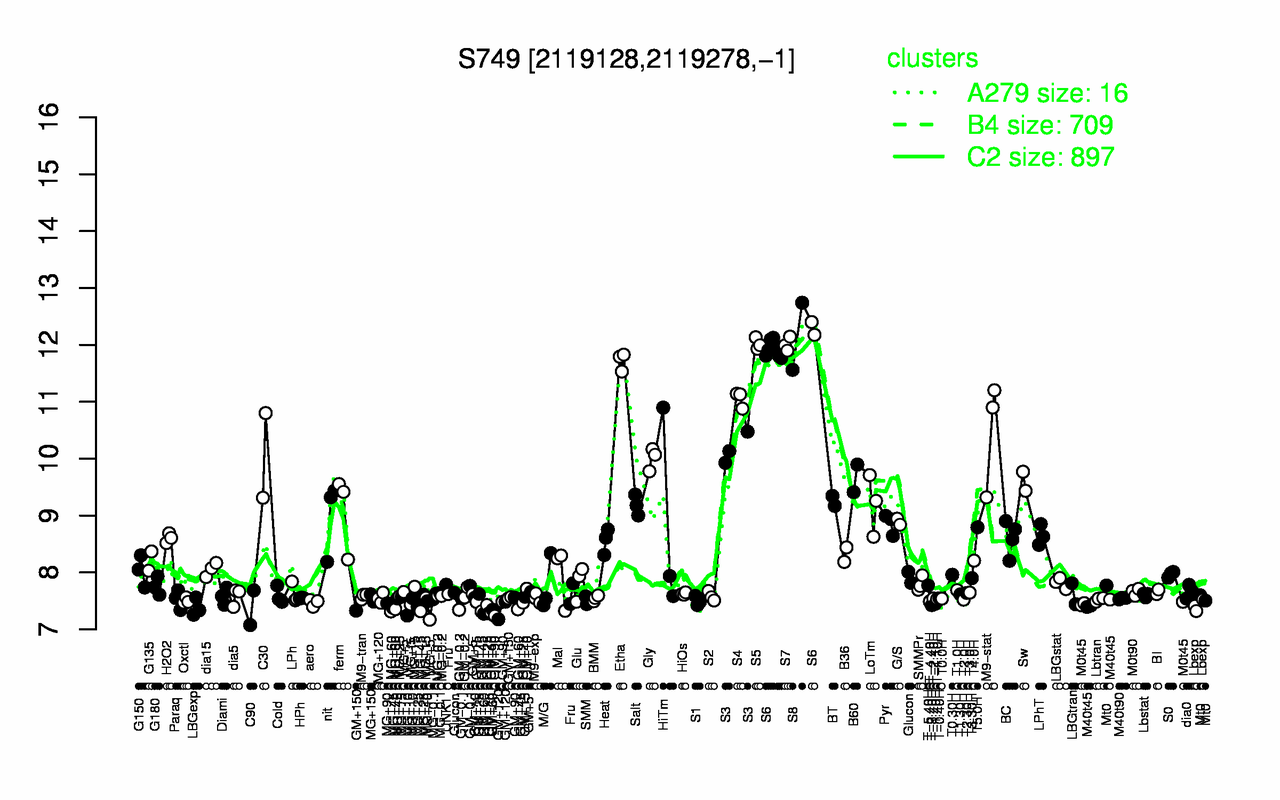
| S8 | S5 | S7 | S6 | Etha | S4 | M9-stat | S3 | C30 | Gly |
| 12.2 | 12 | 12 | 12 | 11.7 | 11.1 | 10.5 | 10.2 | 10.1 | 10 |
| GM+60 | GM+120 | MG+60 | C90 | GM+45 | LBGexp | MG+45 | MG+5 | Lbexp | T-3.40H |
| 7.32 | 7.33 | 7.33 | 7.38 | 7.38 | 7.38 | 7.41 | 7.41 | 7.42 | 7.43 |