| Start Page |
|
 |
| Start Page |
|
|
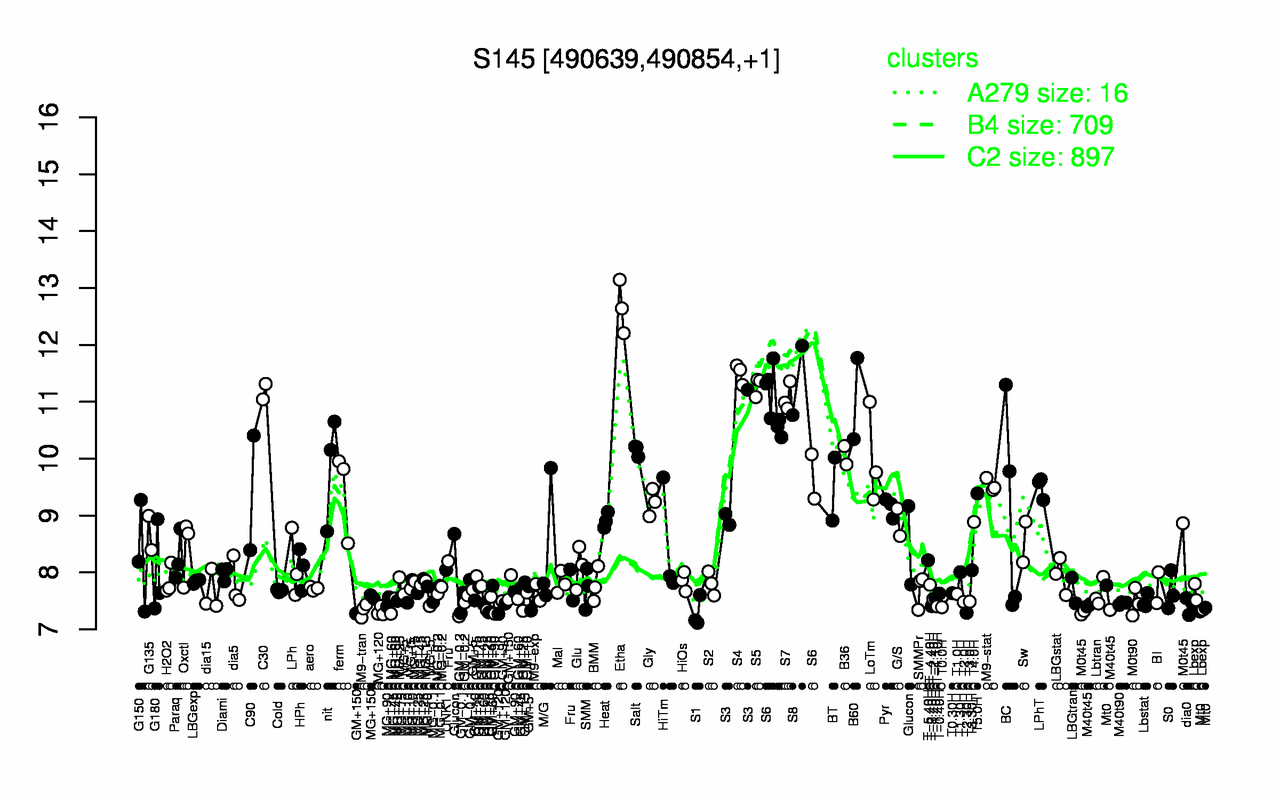
| Etha | S4 | S8 | S5 | C30 | S7 | B60 | S6 | Salt | B36 |
| 12.7 | 11.5 | 11.4 | 11.3 | 11.2 | 11.1 | 11.1 | 10.7 | 10.1 | 10.1 |
| T2.30H | S1 | MG+120 | M9-tran | GM+120 | T0.0H | M40t45 | T-1.10H | T-3.40H | MG+60 |
| 7.29 | 7.29 | 7.32 | 7.34 | 7.36 | 7.39 | 7.4 | 7.4 | 7.41 | 7.41 |