| Start Page |
|
 |
| Start Page |
|
|
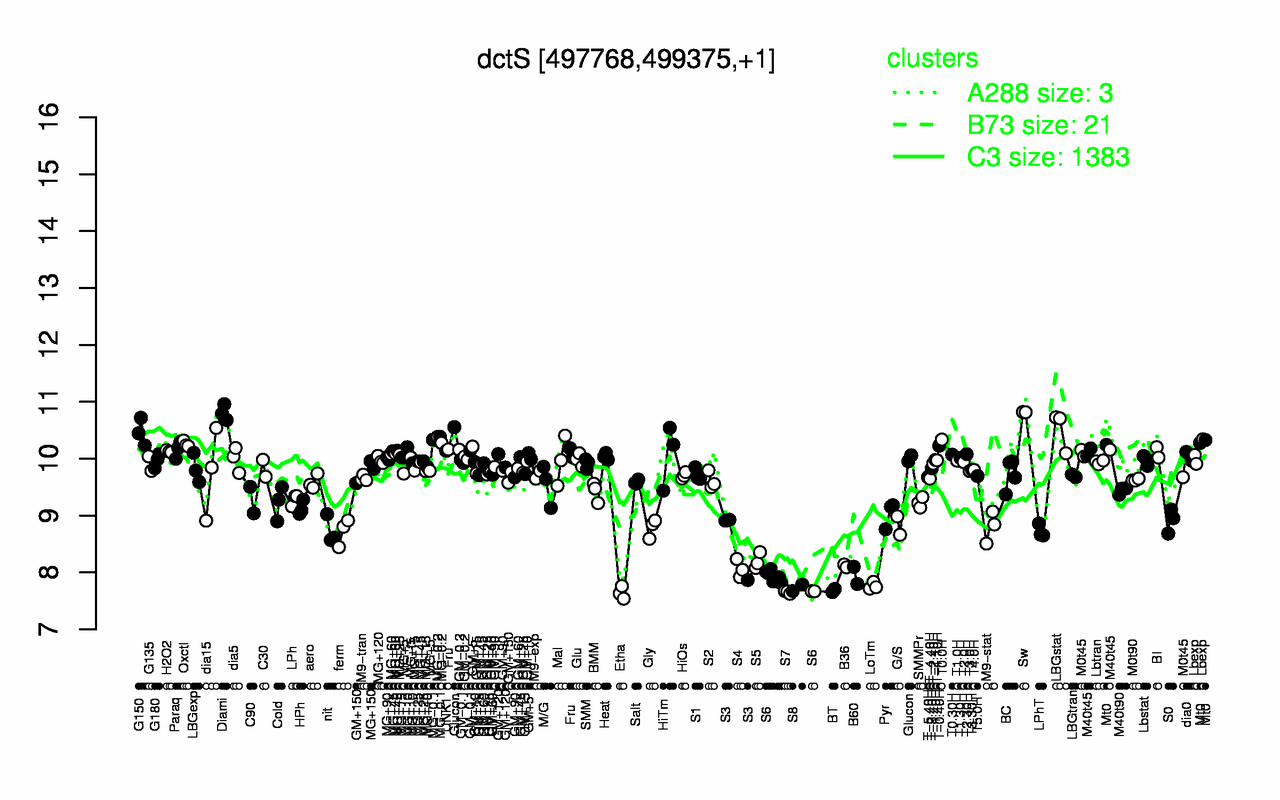
| Sw | Diami | LBGstat | G150 | MG-0.1 | T0.0H | MG-0.2 | Mt0 | Oxctl | T-0.40H |
| 10.8 | 10.8 | 10.5 | 10.5 | 10.3 | 10.3 | 10.3 | 10.3 | 10.3 | 10.2 |
| Etha | S7 | BT | S8 | LoTm | S6 | B60 | S4 | B36 | S5 |
| 7.64 | 7.65 | 7.68 | 7.73 | 7.76 | 7.87 | 7.95 | 8.07 | 8.11 | 8.2 |