| Start Page |
|
 |
| Start Page |
|
|
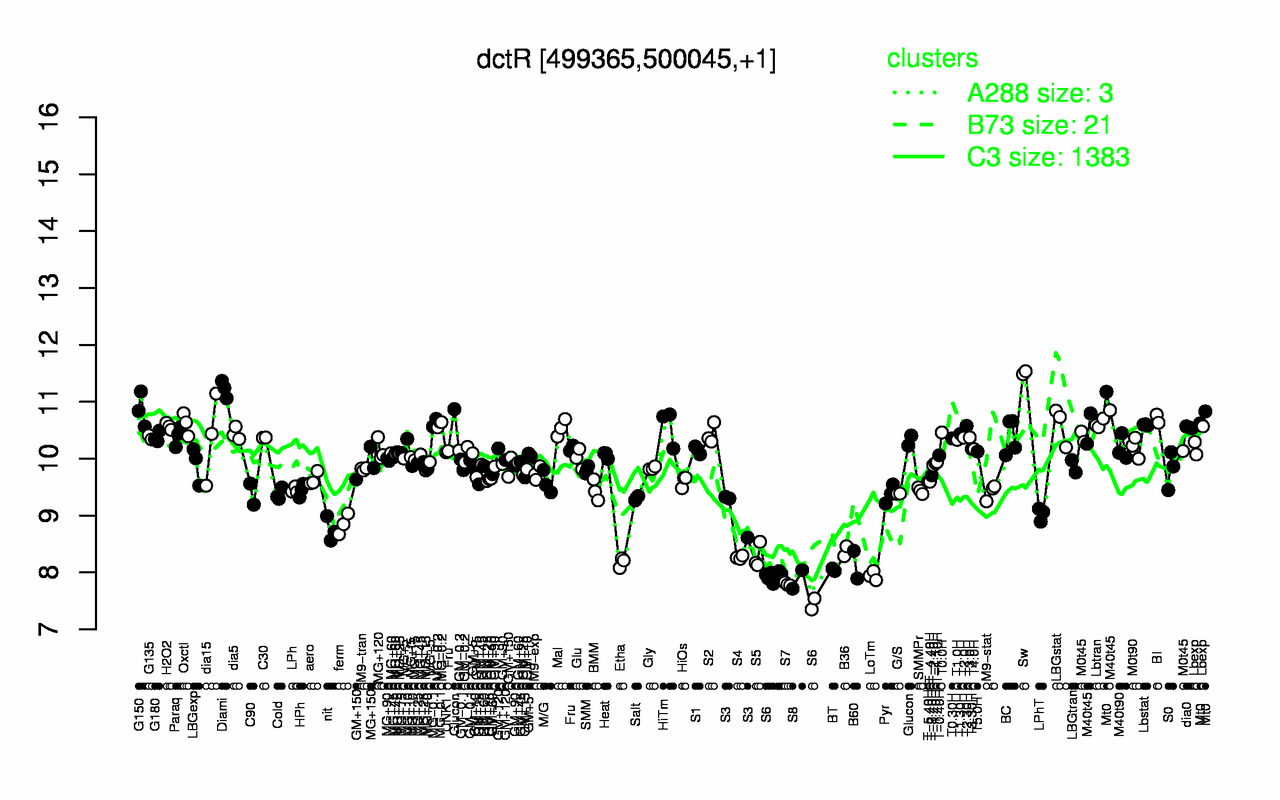
| Sw | Diami | Mt0 | G150 | BI | M40t45 | MG-0.1 | Lbtran | Oxctl | MG-0.2 |
| 11.5 | 11.2 | 10.9 | 10.9 | 10.7 | 10.6 | 10.6 | 10.6 | 10.6 | 10.6 |
| S7 | S6 | S8 | LoTm | BT | B60 | Etha | S4 | S5 | B36 |
| 7.79 | 7.83 | 7.88 | 7.94 | 8.05 | 8.14 | 8.18 | 8.26 | 8.28 | 8.37 |