| Start Page |
|
 |
| Start Page |
|
|
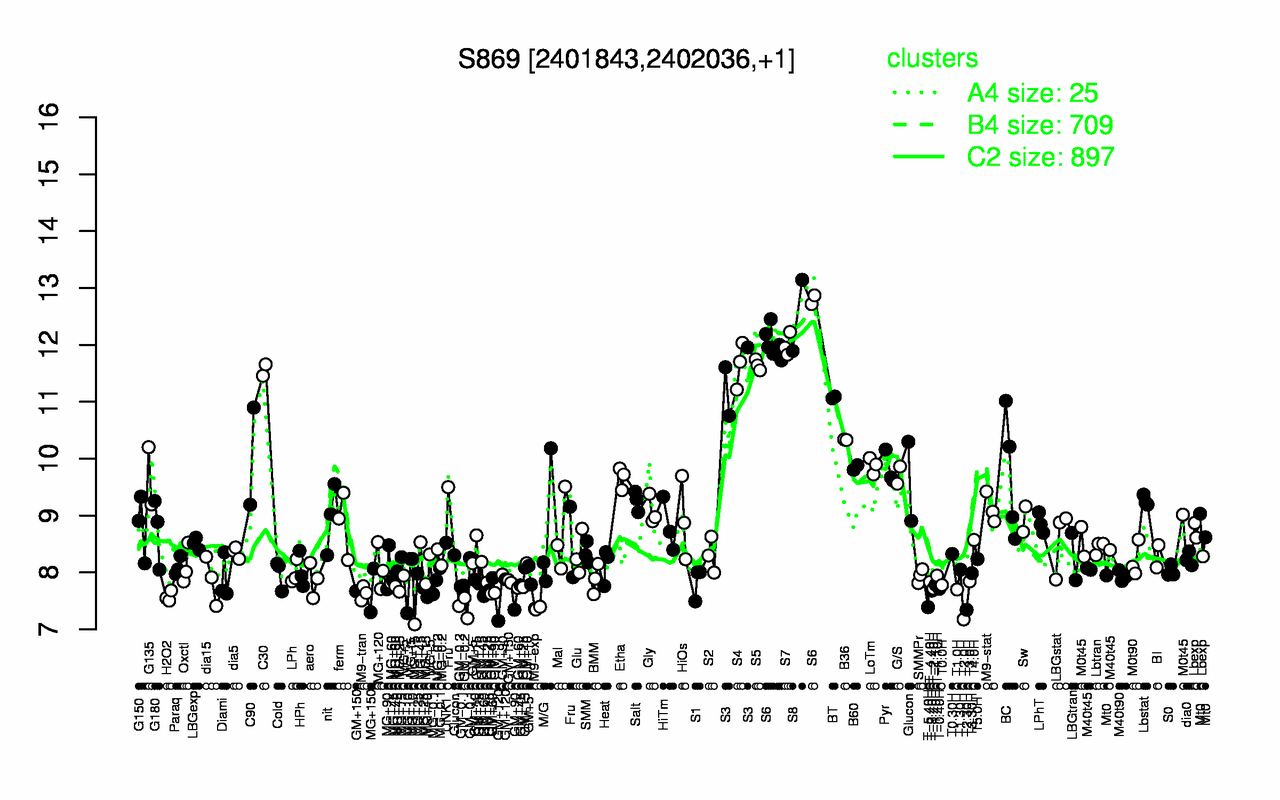
| S8 | S6 | S7 | S4 | S5 | C30 | S3 | BT | B36 | C90 |
| 12.5 | 12.2 | 12 | 11.7 | 11.6 | 11.6 | 11.4 | 11.1 | 10.3 | 10 |
| T2.0H | T2.30H | M9-exp | GM-0.2 | T-5.40H | GM+120 | H2O2 | M9-tran | GM+90 | T-3.40H |
| 7.17 | 7.34 | 7.37 | 7.39 | 7.39 | 7.52 | 7.58 | 7.64 | 7.65 | 7.68 |