| Start Page |
|
 |
| Start Page |
|
|
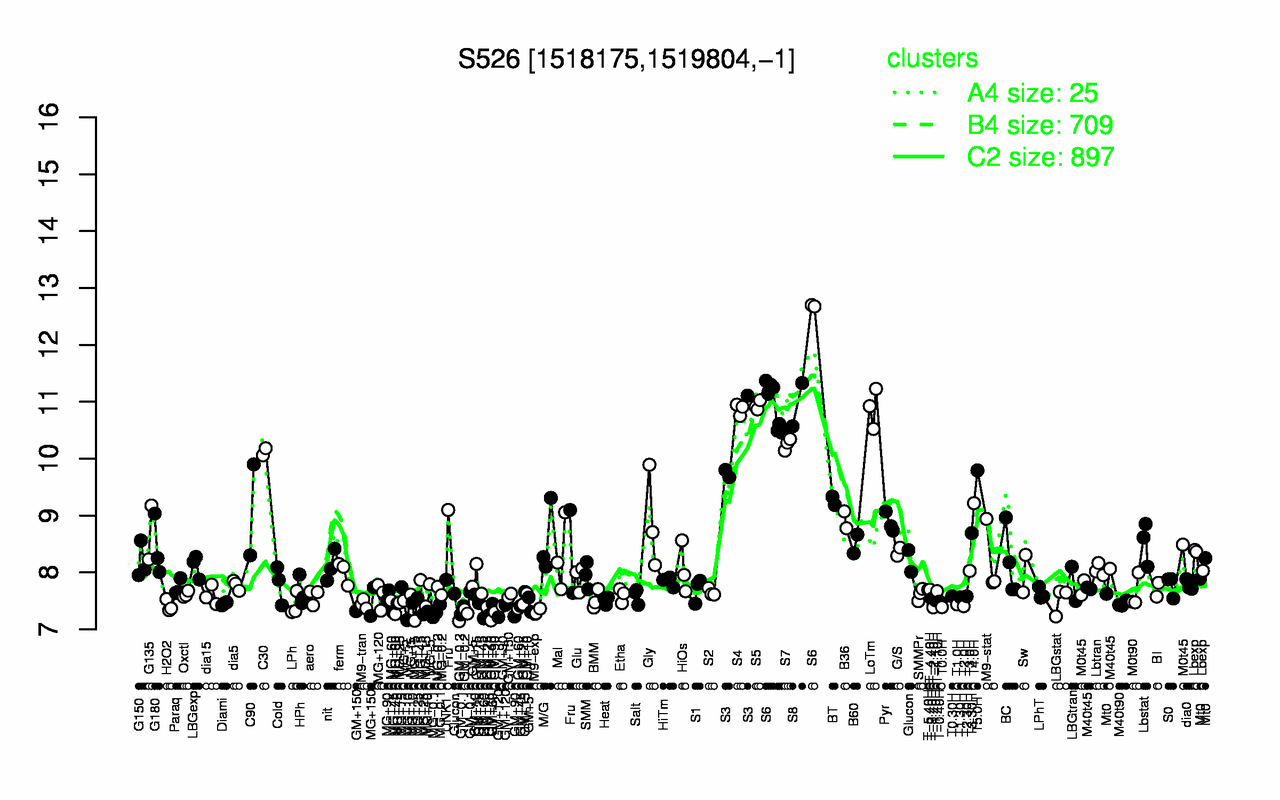
| S6 | S8 | S5 | LoTm | S4 | S7 | S3 | C30 | T5.0H | BT |
| 11.3 | 10.9 | 10.9 | 10.9 | 10.9 | 10.3 | 10.2 | 10.1 | 9.79 | 9.26 |
| GM-0.2 | M9-exp | GM+90 | MG+10 | MG-0.1 | GM+120 | GM+60 | T-2.40H | MG+60 | T0.0H |
| 7.26 | 7.31 | 7.31 | 7.31 | 7.31 | 7.32 | 7.33 | 7.39 | 7.39 | 7.39 |