| Start Page |
|
 |
| Start Page |
|
|
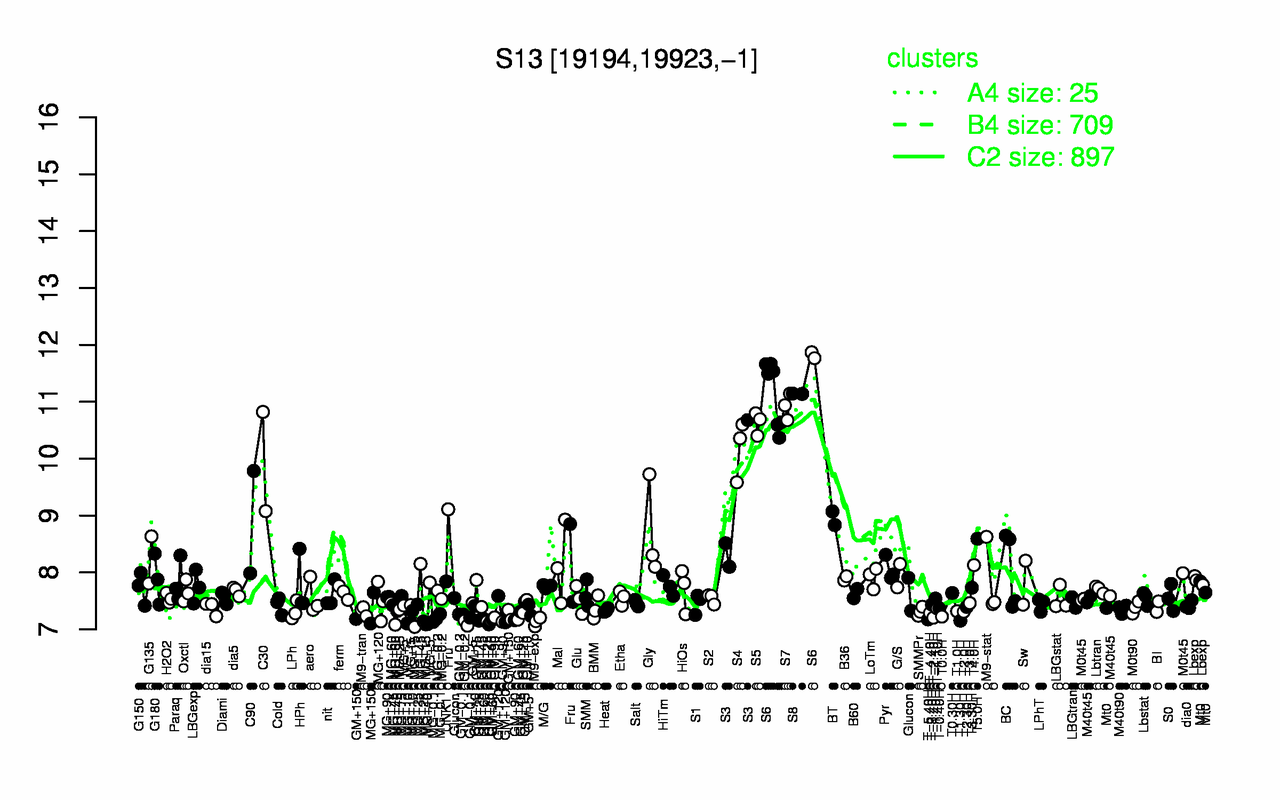
| S6 | S8 | S7 | S5 | S4 | C30 | S3 | BT | C90 | Gly |
| 11.3 | 11.1 | 10.9 | 10.6 | 10.2 | 9.95 | 9.1 | 8.95 | 8.88 | 8.71 |
| M9-exp | T1.30H | GM-0.2 | GM+90 | MG+10 | GM+60 | T-5.40H | GM+25 | MG-0.1 | T-2.40H |
| 7.13 | 7.15 | 7.16 | 7.17 | 7.17 | 7.17 | 7.18 | 7.19 | 7.19 | 7.2 |