| Start Page |
|
 |
| Start Page |
|
|
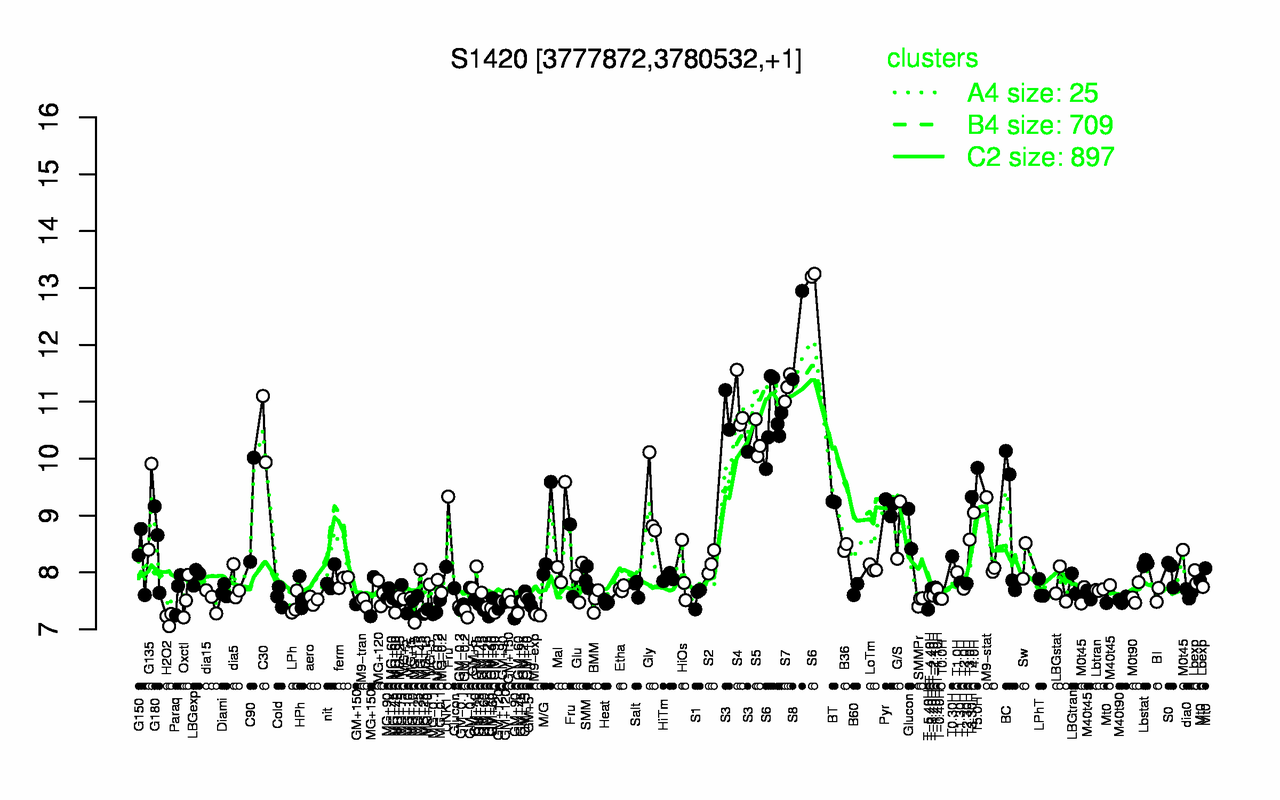
| S8 | S6 | S7 | S4 | S3 | C30 | S5 | T5.0H | T3.30H | BT |
| 12.2 | 11.3 | 11.2 | 11 | 10.6 | 10.5 | 10.3 | 9.84 | 9.33 | 9.24 |
| H2O2 | M9-exp | GM-0.2 | GM+90 | T-5.40H | MG-0.1 | MG+10 | GM+60 | MG+60 | MG+15 |
| 7.19 | 7.26 | 7.32 | 7.32 | 7.35 | 7.36 | 7.38 | 7.39 | 7.39 | 7.4 |