| Start Page |
|
 |
| Start Page |
|
|
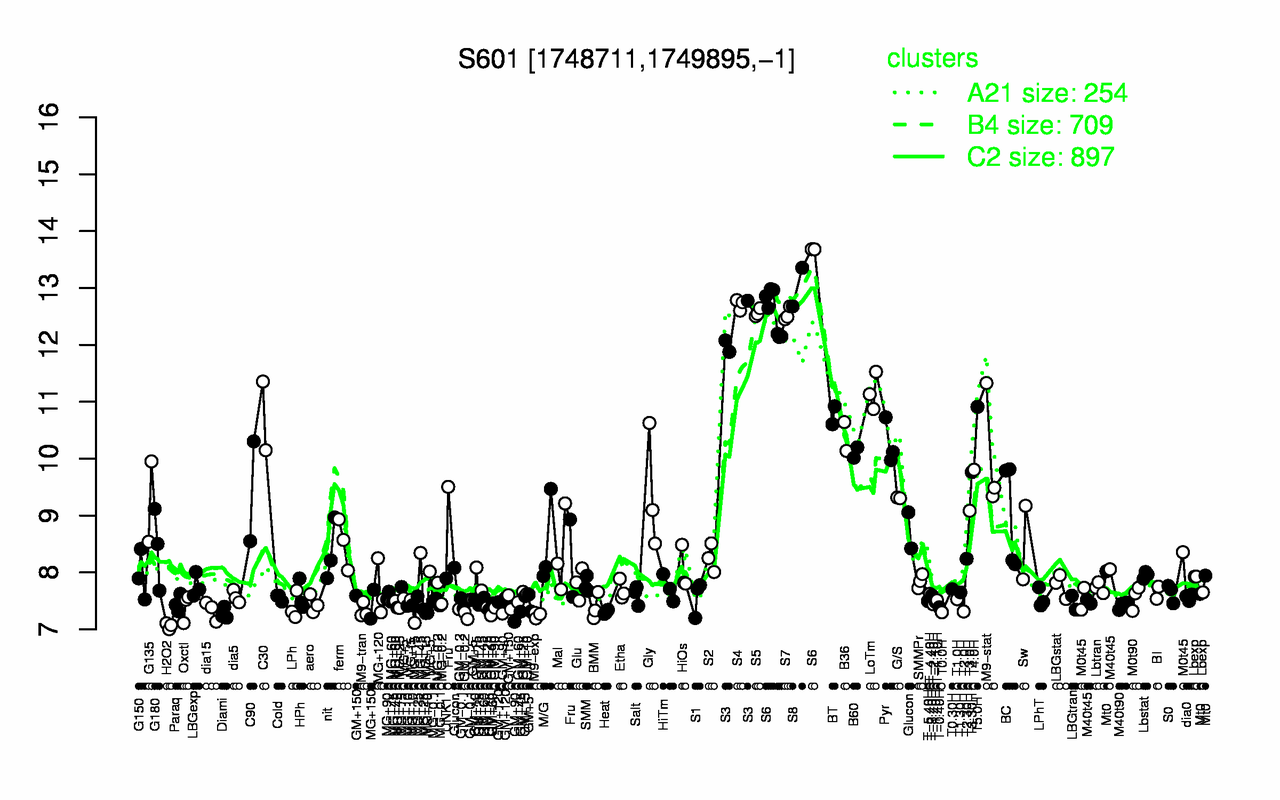
| S8 | S6 | S4 | S5 | S7 | S3 | LoTm | T5.0H | BT | C30 |
| 13 | 12.8 | 12.7 | 12.6 | 12.5 | 12.2 | 11.2 | 10.9 | 10.8 | 10.8 |
| H2O2 | M9-exp | GM+90 | Diami | GM-0.2 | T0.0H | Heat | T2.0H | dia15 | M9-tran |
| 7.06 | 7.25 | 7.26 | 7.28 | 7.28 | 7.3 | 7.3 | 7.31 | 7.33 | 7.33 |