| Start Page |
|
 |
| Start Page |
|
|
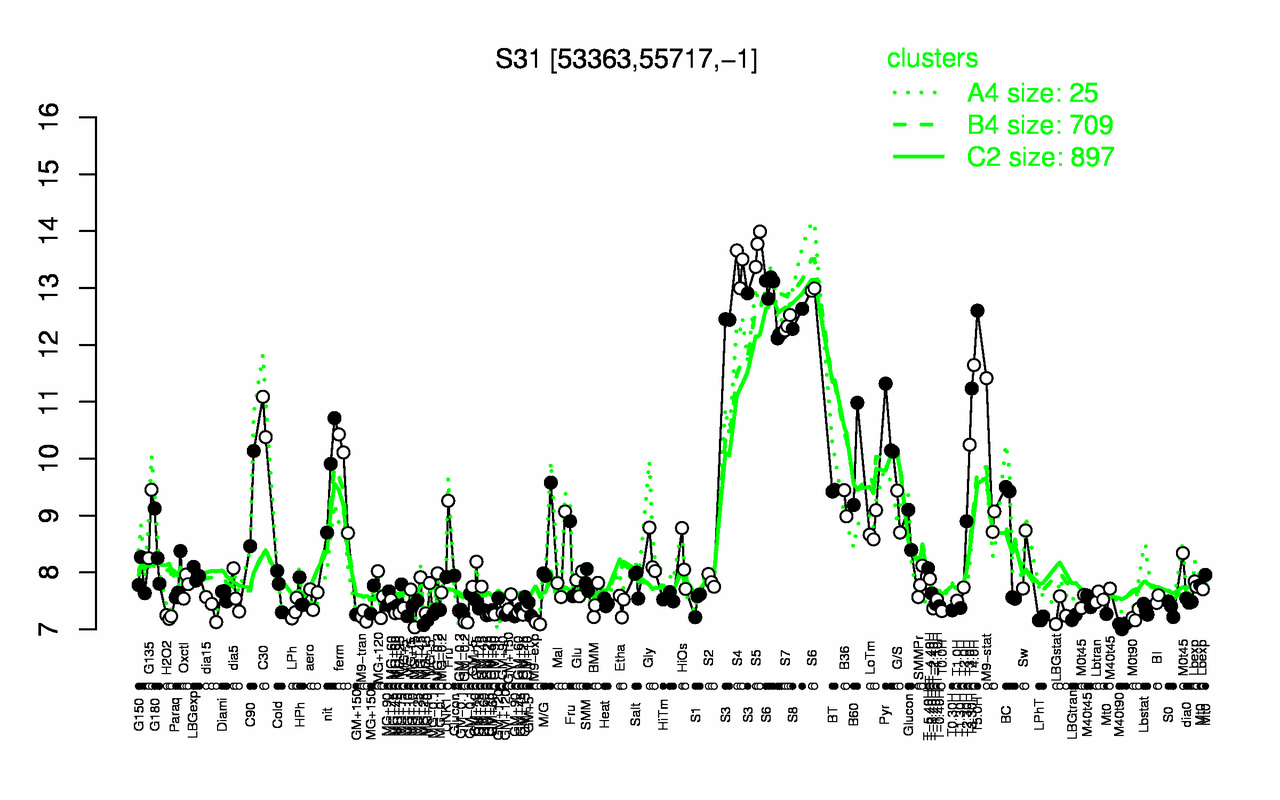
| S5 | S4 | S6 | T5.0H | S3 | S8 | S7 | T4.0H | T3.30H | C30 |
| 13.7 | 13.4 | 12.7 | 12.6 | 12.6 | 12.5 | 12.4 | 11.6 | 11.2 | 10.7 |
| M40t90 | M9-exp | LPhT | GM-0.2 | LBGtran | H2O2 | M9-tran | M0t90 | GM+90 | MG+10 |
| 7.07 | 7.12 | 7.18 | 7.19 | 7.21 | 7.22 | 7.23 | 7.24 | 7.26 | 7.27 |