| Start Page |
|
 |
| Start Page |
|
|
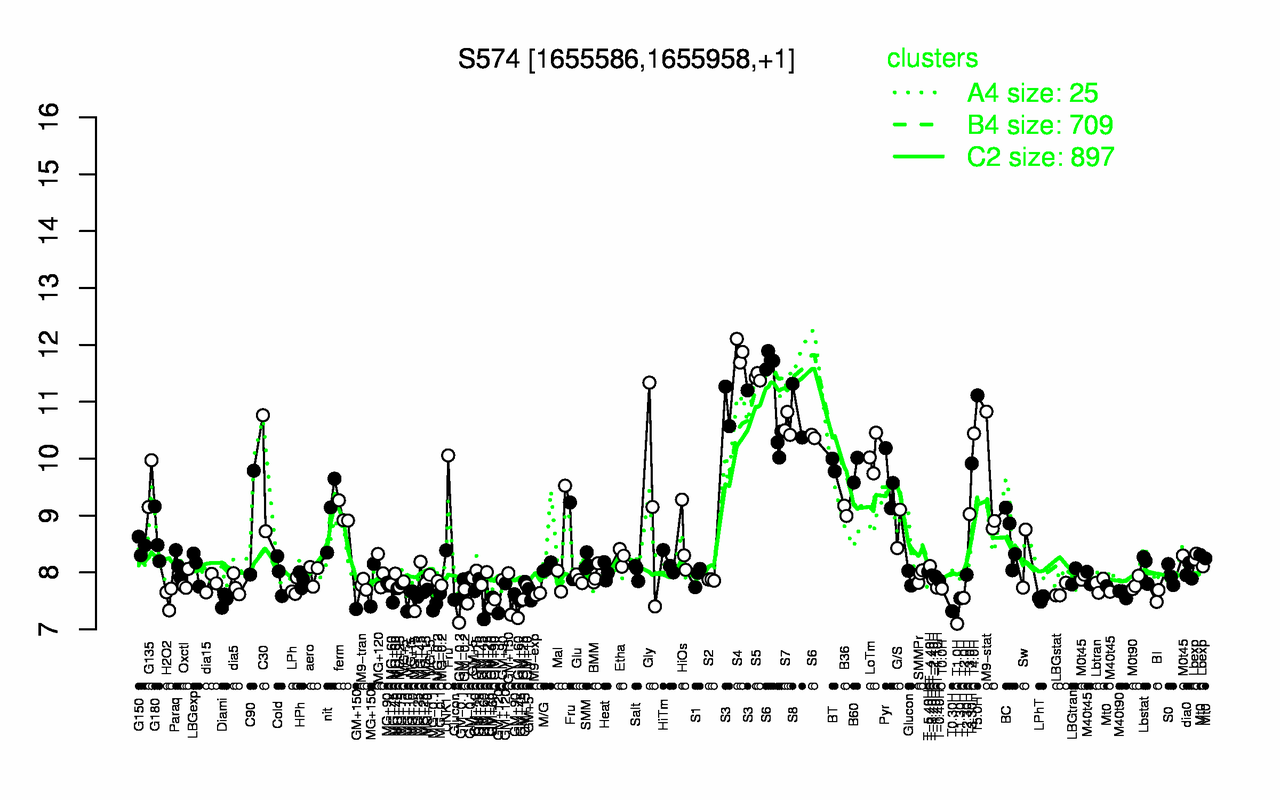
| S4 | S5 | T5.0H | S3 | S6 | S8 | S7 | T4.0H | LoTm | T3.30H |
| 11.9 | 11.4 | 11.1 | 11 | 10.9 | 10.8 | 10.6 | 10.4 | 10.1 | 9.92 |
| T1.0H | GM+60 | T0.30H | GM-0.2 | MG-0.1 | Diami | GM+150 | LPhT | T1.30H | GM+120 |
| 7.1 | 7.31 | 7.32 | 7.42 | 7.47 | 7.51 | 7.53 | 7.54 | 7.54 | 7.55 |