| Start Page |
|
 |
| Start Page |
|
|
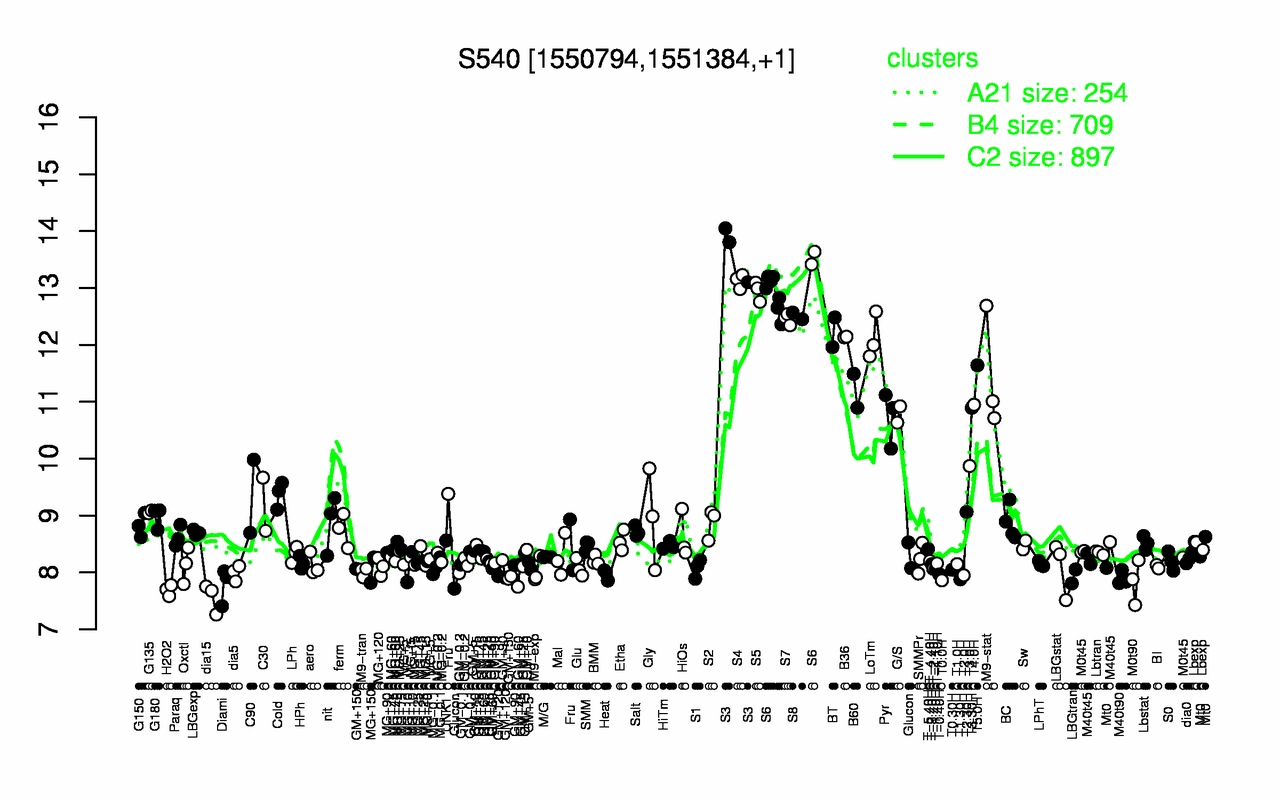
| S3 | S4 | S6 | S5 | S8 | S7 | BT | B36 | LoTm | T5.0H |
| 13.7 | 13.1 | 13 | 12.9 | 12.5 | 12.5 | 12.2 | 12.1 | 12.1 | 11.6 |
| dia15 | H2O2 | Diami | M0t90 | T0.0H | T1.30H | M40t90 | GM+120 | LBGtran | T2.0H |
| 7.56 | 7.69 | 7.78 | 7.84 | 7.86 | 7.88 | 7.9 | 7.92 | 7.93 | 7.95 |