| Start Page |
|
 |
| Start Page |
|
|
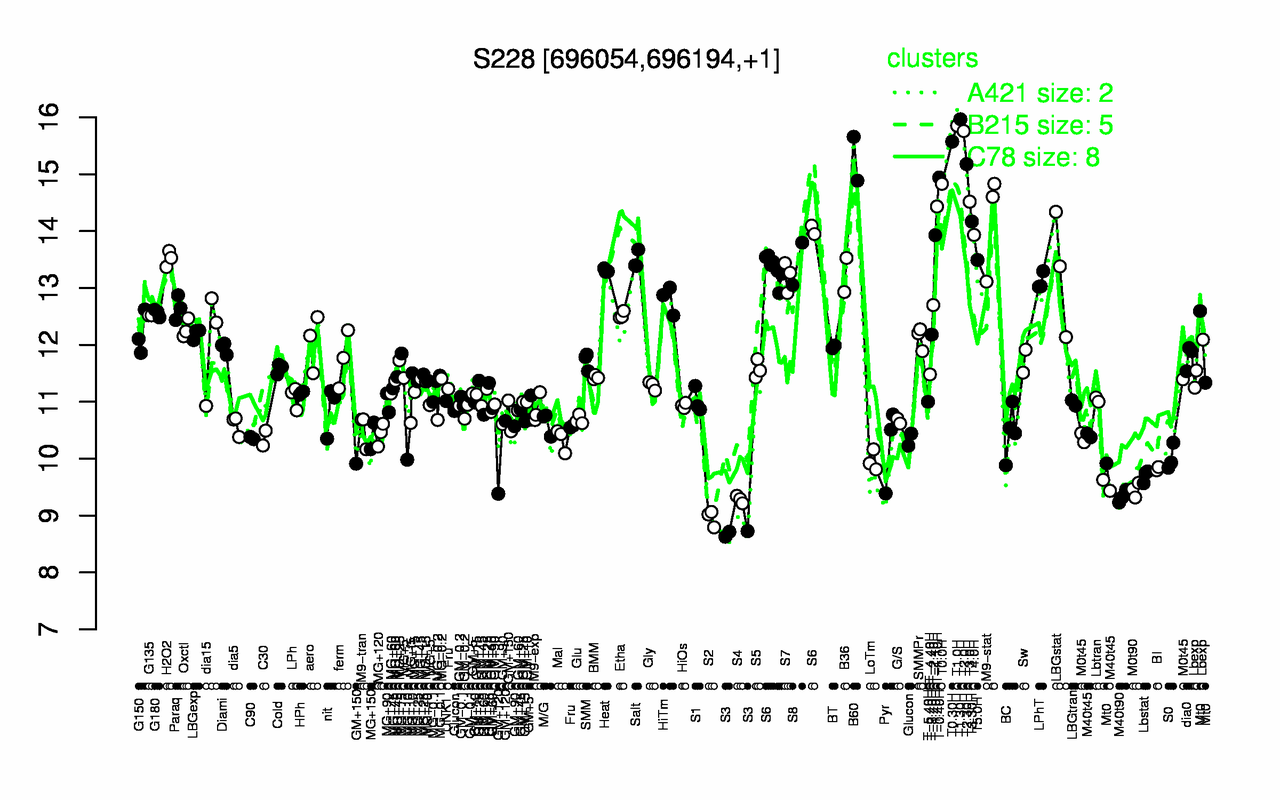
| T1.30H | T1.0H | T2.0H | T0.30H | B60 | T2.30H | T-0.40H | T0.0H | T3.0H | T-1.10H |
| 16 | 15.9 | 15.8 | 15.6 | 15.3 | 15.2 | 14.9 | 14.8 | 14.5 | 14.4 |
| S3 | S2 | S4 | M40t90 | M0t90 | Lbstat | BI | LoTm | S0 | GM+120 |
| 8.69 | 8.96 | 9.28 | 9.33 | 9.45 | 9.7 | 9.82 | 9.96 | 10 | 10 |