| Start Page |
|
 |
| Start Page |
|
|
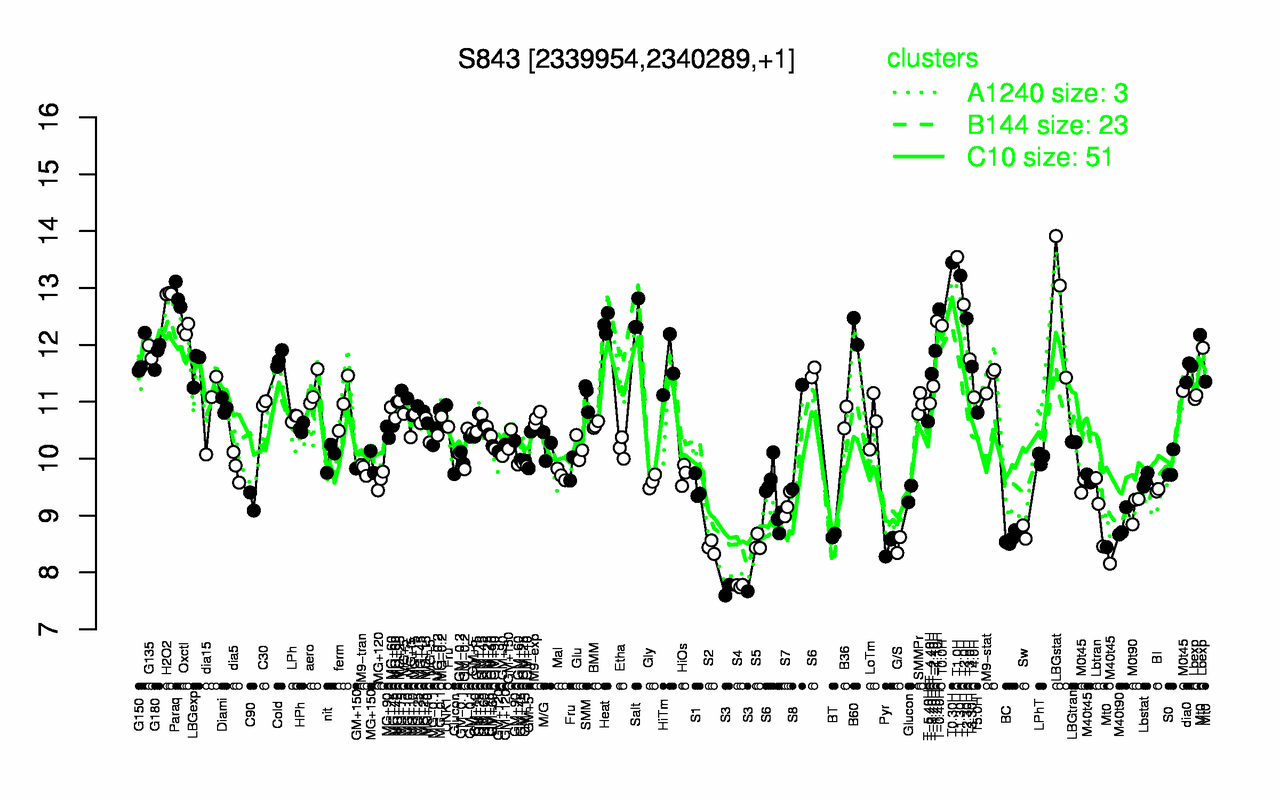
| T1.0H | T0.30H | T1.30H | H2O2 | Paraq | LBGstat | T2.0H | T-0.40H | Salt | T2.30H |
| 13.5 | 13.4 | 13.2 | 12.9 | 12.9 | 12.8 | 12.7 | 12.6 | 12.5 | 12.5 |
| S3 | S4 | S2 | G/S | Pyr | S5 | BC | BT | Sw | M40t90 |
| 7.68 | 7.77 | 8.44 | 8.48 | 8.49 | 8.51 | 8.59 | 8.65 | 8.71 | 8.84 |