| Start Page |
|
 |
| Start Page |
|
|
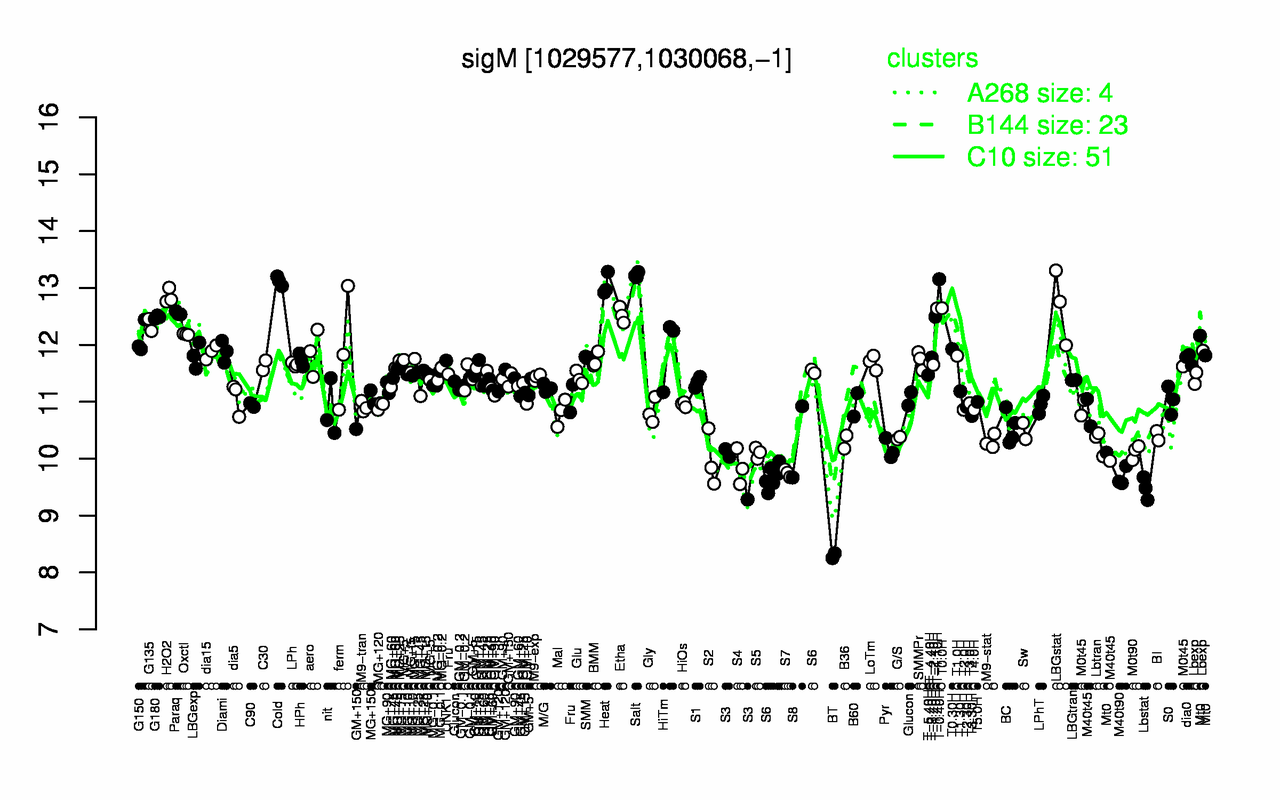
| Salt | T-0.40H | Cold | Heat | H2O2 | LBGstat | T0.0H | T-1.10H | Paraq | Etha |
| 13.2 | 13.2 | 13.1 | 13.1 | 12.9 | 12.7 | 12.6 | 12.6 | 12.6 | 12.5 |
| BT | Lbstat | M40t90 | S7 | S3 | S4 | S2 | S5 | S6 | M0t90 |
| 8.29 | 9.48 | 9.68 | 9.75 | 9.83 | 9.85 | 9.98 | 10.1 | 10.1 | 10.1 |