| Start Page |
|
 |
| Start Page |
|
|
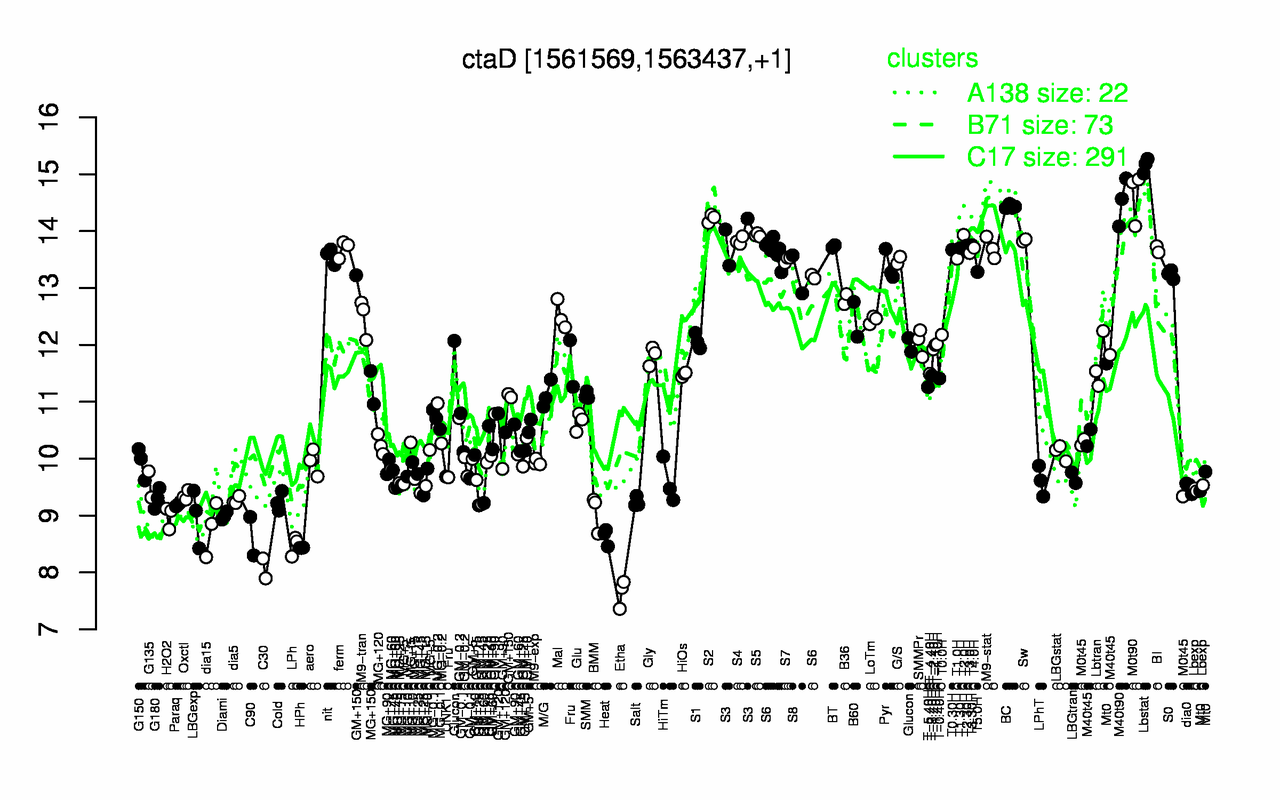
| Lbstat | M0t90 | M40t90 | BC | S2 | T2.0H | S5 | S3 | Sw | S4 |
| 15.2 | 14.6 | 14.5 | 14.4 | 14.2 | 13.9 | 13.9 | 13.9 | 13.8 | 13.8 |
| Etha | C30 | HPh | LPh | Heat | C90 | dia15 | LBGexp | H2O2 | Diami |
| 7.64 | 8.07 | 8.43 | 8.48 | 8.63 | 8.64 | 8.78 | 8.98 | 8.99 | 9 |