| Start Page |
|
 |
| Start Page |
|
|
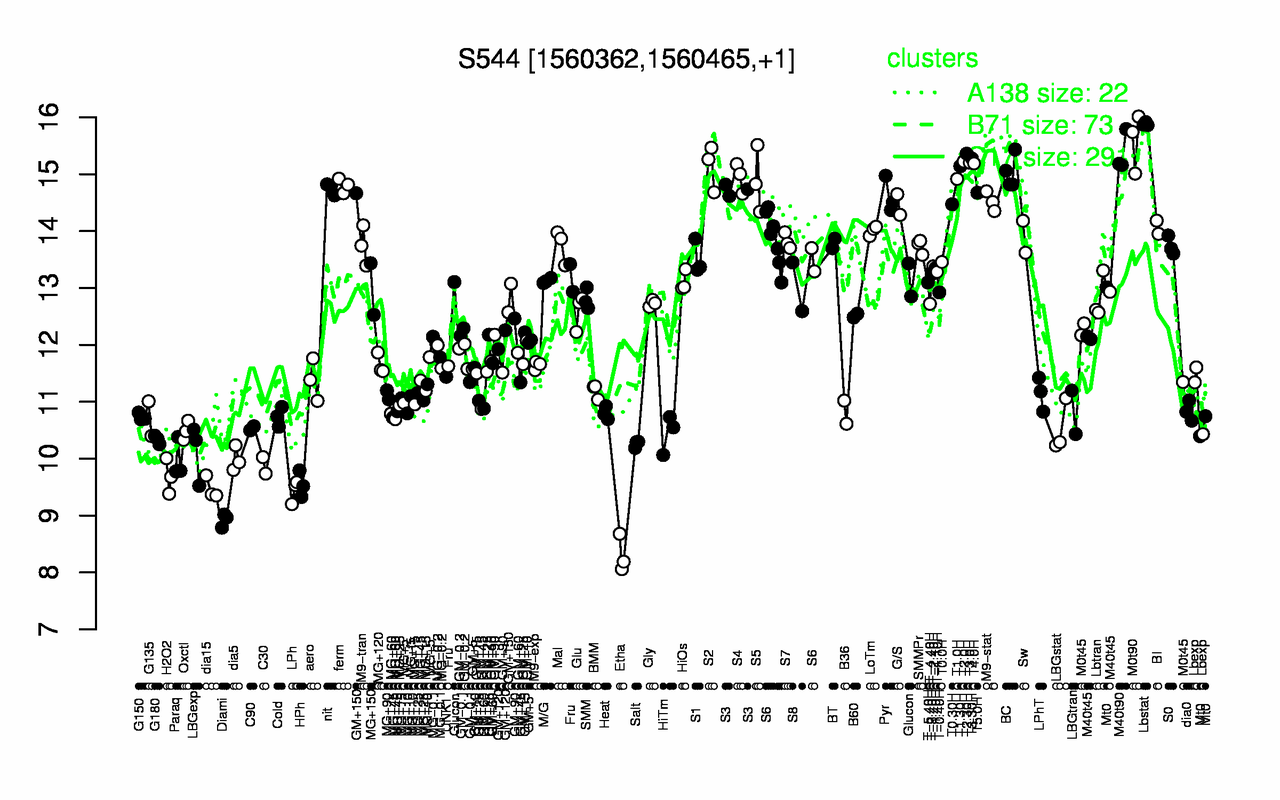
| Lbstat | M0t90 | M40t90 | T2.30H | T3.30H | T2.0H | T3.0H | T4.0H | T1.30H | S2 |
| 15.9 | 15.6 | 15.4 | 15.4 | 15.3 | 15.2 | 15.2 | 15.2 | 15.1 | 15.1 |
| Etha | Diami | LPh | dia15 | HPh | H2O2 | C30 | Paraq | dia5 | LBGexp |
| 8.31 | 8.92 | 9.44 | 9.48 | 9.55 | 9.69 | 9.88 | 9.98 | 9.99 | 10.1 |