| Start Page |
|
 |
| Start Page |
|
|
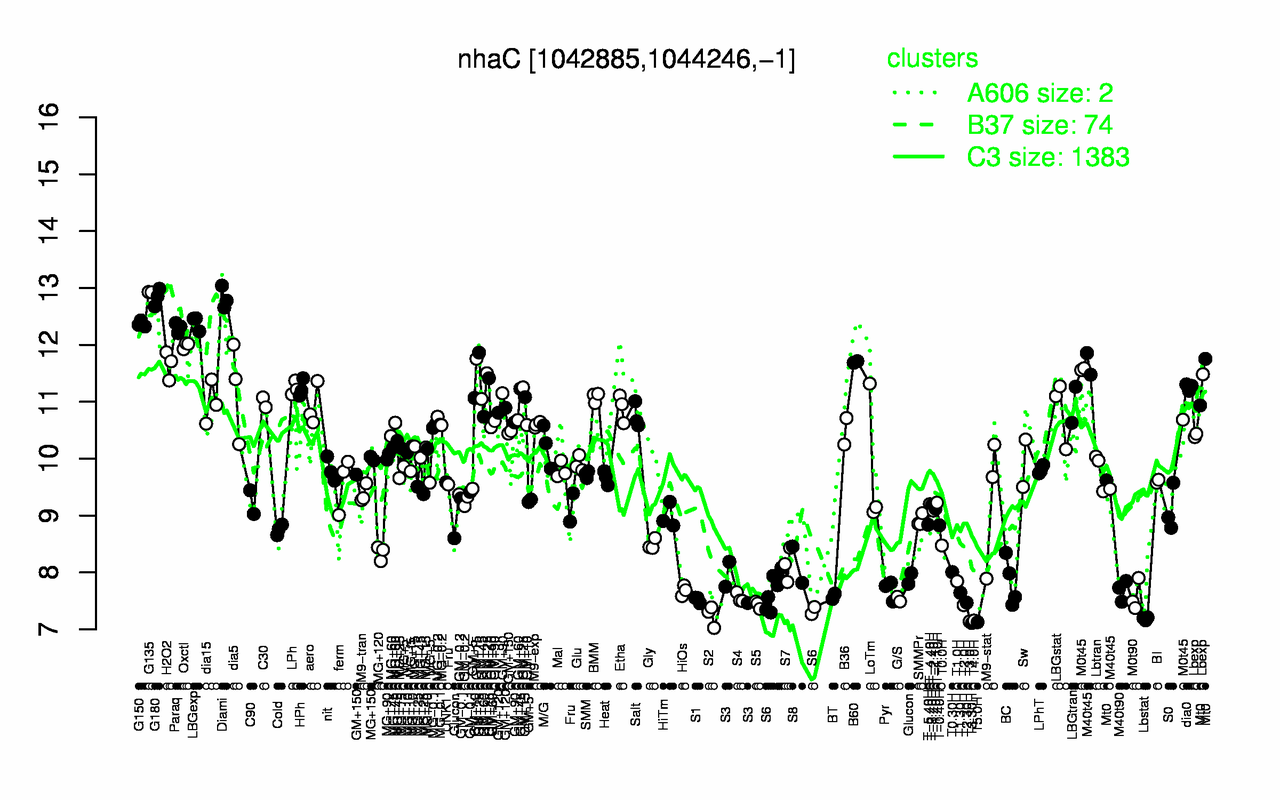
| G135 | G180 | Diami | LBGexp | G150 | Paraq | Oxctl | B60 | H2O2 | GM+25 |
| 12.9 | 12.8 | 12.8 | 12.4 | 12.4 | 12.3 | 12 | 11.7 | 11.7 | 11.5 |
| T3.30H | T5.0H | T3.0H | T4.0H | Lbstat | S2 | T2.0H | S5 | T2.30H | S1 |
| 7.11 | 7.13 | 7.14 | 7.15 | 7.19 | 7.24 | 7.43 | 7.43 | 7.47 | 7.52 |