| Start Page |
|
 |
| Start Page |
|
|
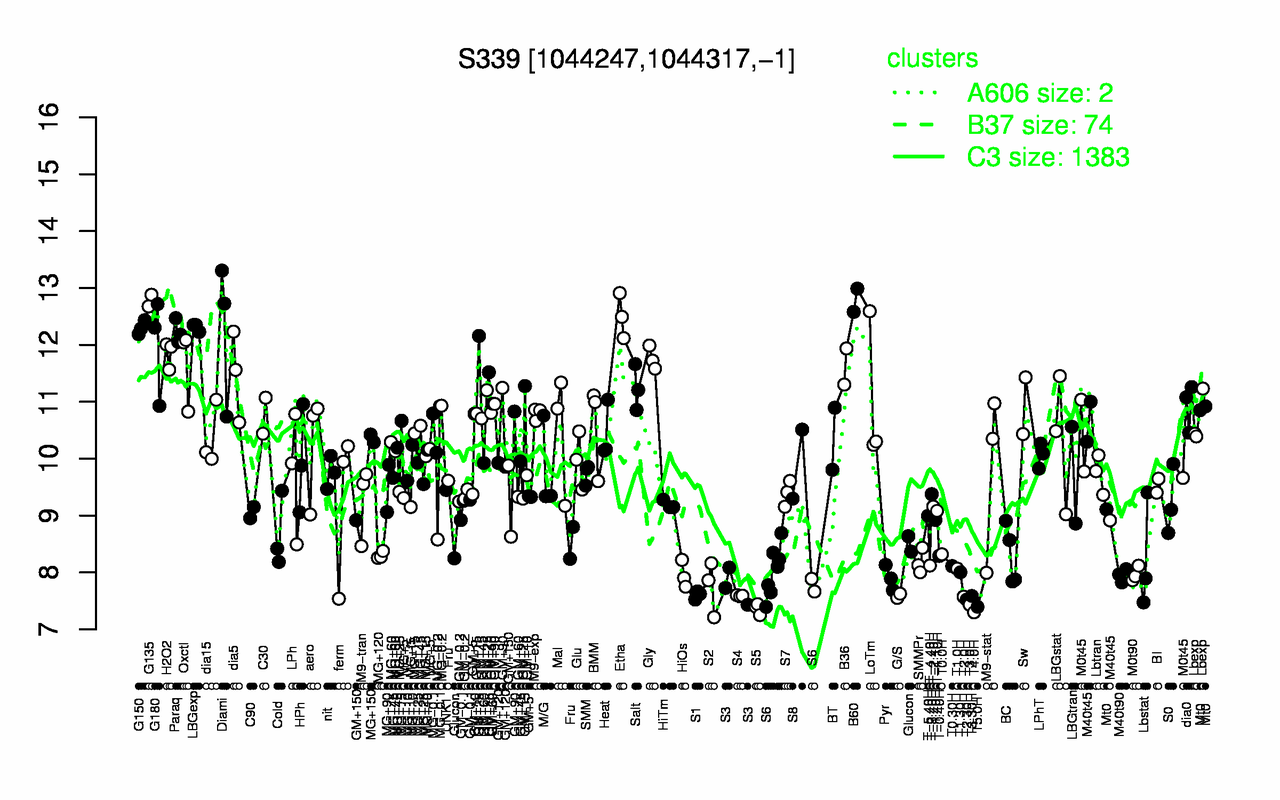
| B60 | G135 | Etha | LBGexp | G150 | Diami | Paraq | G180 | H2O2 | Gly |
| 12.8 | 12.8 | 12.5 | 12.3 | 12.3 | 12.3 | 12.2 | 12 | 11.8 | 11.8 |
| T4.0H | S5 | T5.0H | T3.0H | T2.30H | T2.0H | T3.30H | G/S | S4 | S1 |
| 7.3 | 7.36 | 7.39 | 7.43 | 7.52 | 7.57 | 7.59 | 7.59 | 7.59 | 7.6 |