| Start Page |
|
 |
| Start Page |
|
|
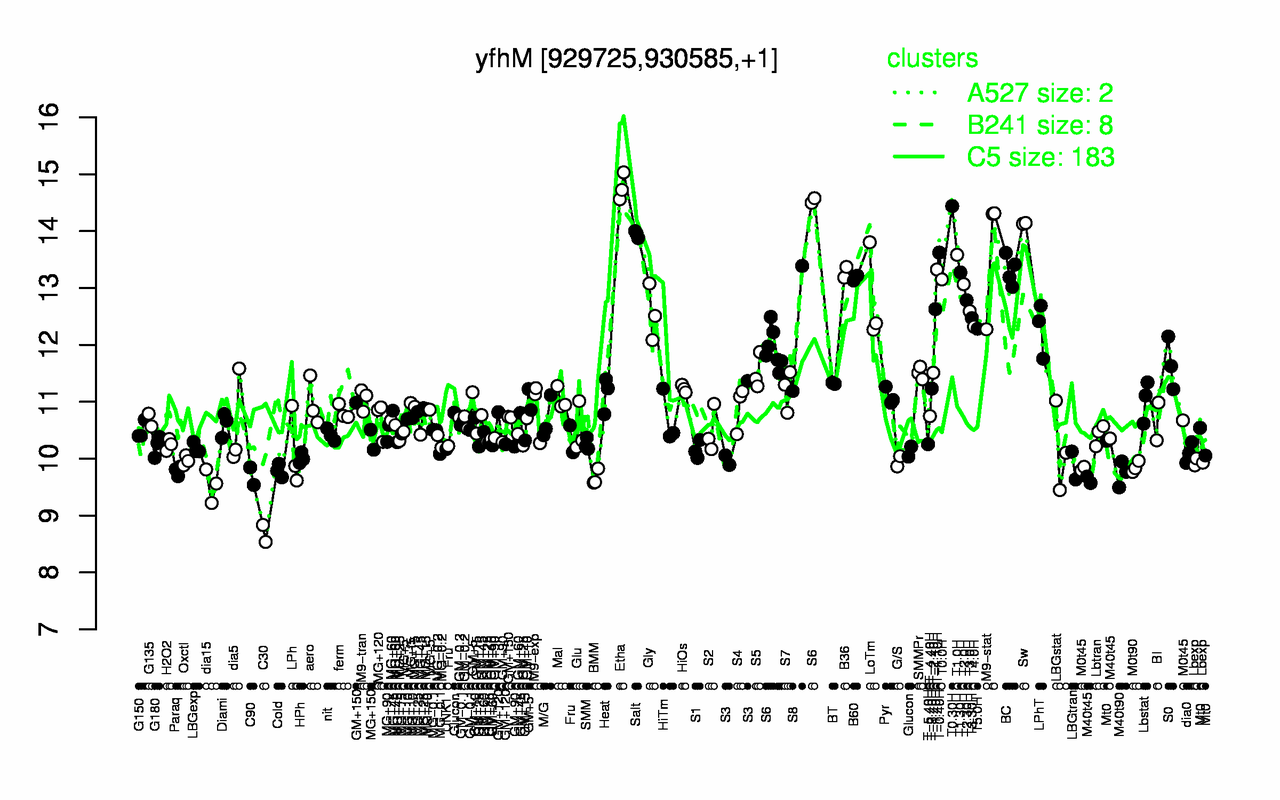
| Etha | T0.30H | Sw | Salt | M9-stat | T-0.40H | T1.0H | T-1.10H | BC | B36 |
| 14.8 | 14.4 | 14.1 | 13.9 | 13.6 | 13.6 | 13.6 | 13.3 | 13.3 | 13.3 |
| C30 | dia15 | BMM | C90 | M40t90 | Paraq | Cold | M0t90 | M40t45 | LBGtran |
| 8.69 | 9.53 | 9.66 | 9.69 | 9.74 | 9.79 | 9.79 | 9.85 | 9.87 | 9.88 |