B. subtilis Expression Data Browser
Start Page
B. subtilis Expression Data Browser
Gene/Segment:
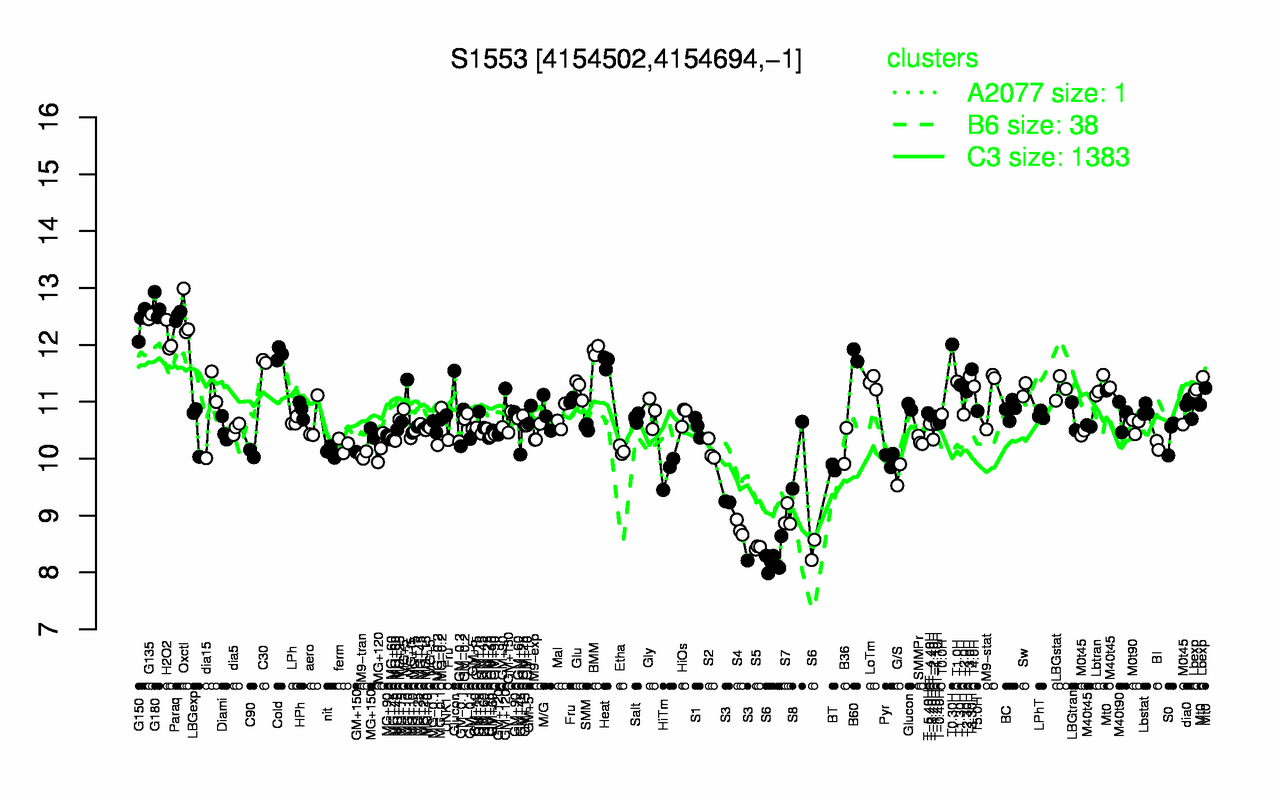
S1553
Locus Tag:
new_4154502_4154694_c
Details about S1553
Show/Hide
Highest Expression Conditions
G180
Paraq
Oxctl
G135
G150
H2O2
T0.30H
BMM
Cold
B60
12.7
12.5
12.5
12.5
12.4
12.1
12
11.9
11.8
11.8
Lowest Expression Conditions
S6
S5
S4
S3
S7
G/S
HiTm
BT
Pyr
M9-tran
8.27
8.44
8.77
8.9
8.98
9.72
9.77
9.84
10
10.1
Most Positively Correlated Segments
walR
walK
S1552
divIB
walH
yycI
recF
S1080
ybfM
S915
0.83
0.83
0.81
0.8
0.79
0.78
0.78
0.76
0.75
0.74
Most Negatively Correlated Segments
yusW
ypbQ
bcsA
sspL
yhzD
phrI
yhfW
yngL
yvaM
S1150
-0.75
-0.71
-0.71
-0.71
-0.7
-0.7
-0.69
-0.69
-0.69
-0.69
Expression Profile of Segment S1553
Show/Hide
Genomic View of Gene/Segment S1553
Show/Hide
(Legend)
Browse Genome Context