B. subtilis Expression Data Browser
Start Page
B. subtilis Expression Data Browser
Gene/Segment:
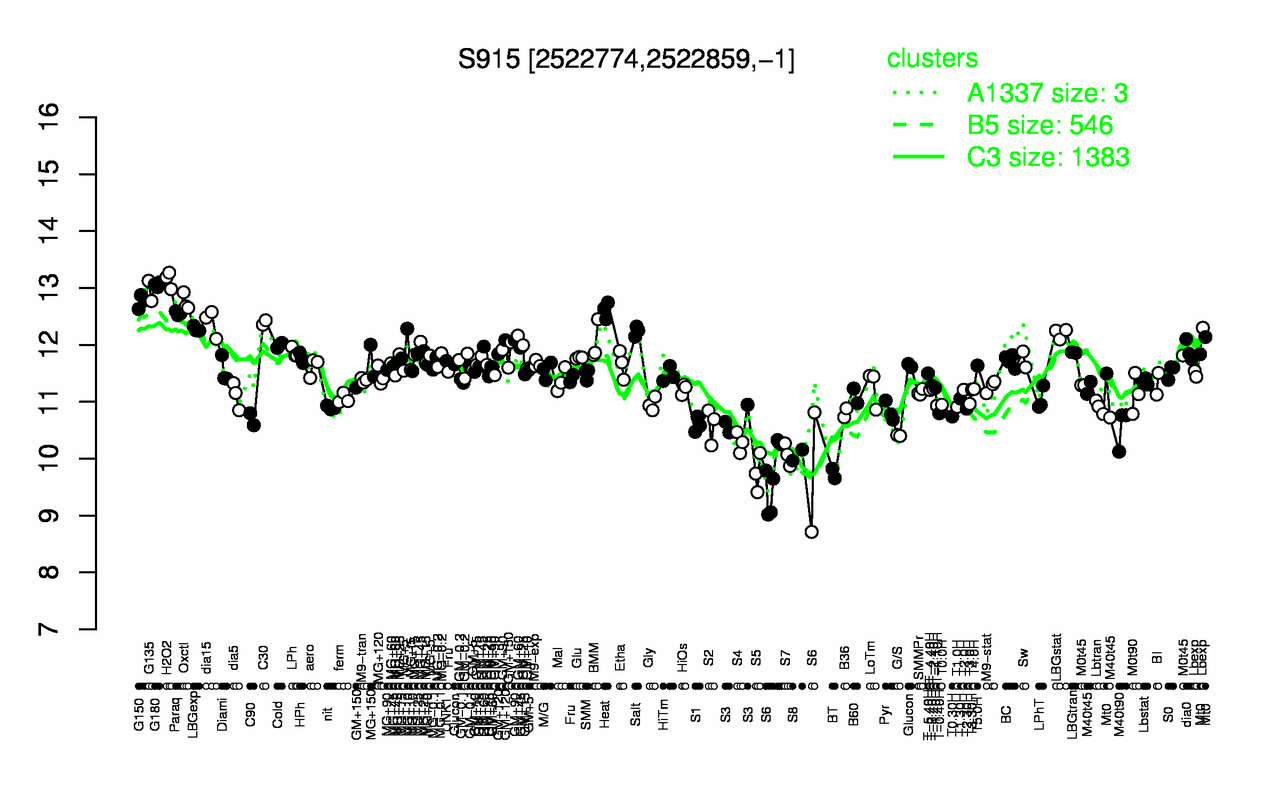
S915
Locus Tag:
new_2522774_2522859_c
Details about S915
Show/Hide
Highest Expression Conditions
H2O2
G180
G135
G150
Oxctl
Heat
Paraq
C30
dia15
LBGexp
13.1
13.1
12.9
12.8
12.8
12.6
12.6
12.4
12.4
12.3
Lowest Expression Conditions
BT
S5
S6
S8
S7
S4
G/S
M40t90
S2
S1
9.74
9.75
9.77
10.1
10.1
10.3
10.4
10.5
10.6
10.6
Most Positively Correlated Segments
ahrC
yrrB
dagK
rbgA
recJ
yrrC
S1456
yrrM
spcB
smc
0.89
0.86
0.86
0.86
0.86
0.85
0.85
0.84
0.84
0.84
Most Negatively Correlated Segments
yhzD
phrC
yvaM
spoIIAA
sigF
spoIIAB
S402
ybbF
S1150
mpr
-0.81
-0.8
-0.76
-0.75
-0.74
-0.74
-0.74
-0.73
-0.73
-0.73
Expression Profile of Segment S915
Show/Hide
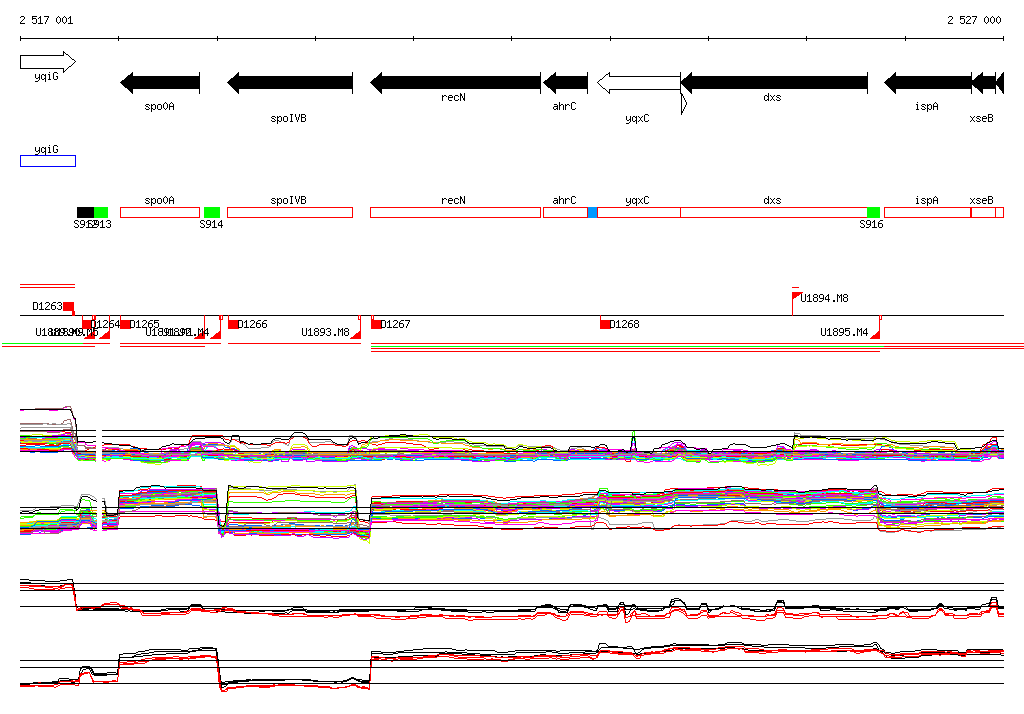
Genomic View of Gene/Segment S915
Show/Hide
(Legend)
Browse Genome Context