B. subtilis Expression Data Browser
Start Page
B. subtilis Expression Data Browser
Gene/Segment:
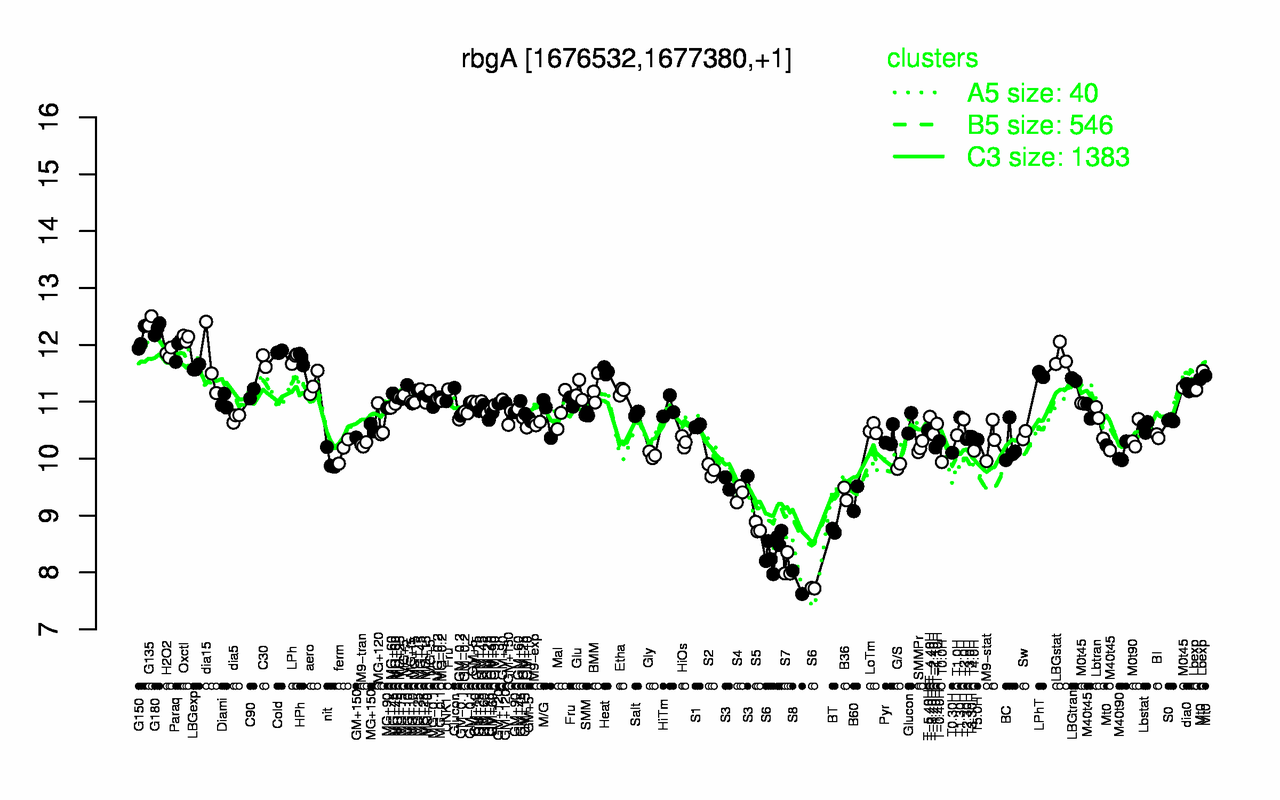
rbgA
Locus Tag:
BSU16050
Details about rbgA
Show/Hide
Highest Expression Conditions
G135
G180
Oxctl
G150
Paraq
Cold
H2O2
LBGstat
LPh
HPh
12.4
12.3
12.1
12.1
11.9
11.9
11.9
11.8
11.8
11.8
Lowest Expression Conditions
S8
S7
S6
BT
S5
B60
B36
S4
S3
S2
7.83
8.11
8.25
8.73
8.78
9.3
9.38
9.39
9.61
9.8
Most Positively Correlated Segments
S581
ybaR
asnS
yhdH
coaBC
pgsA
spcB
dgk
yyaE
walK
0.93
0.92
0.91
0.89
0.89
0.89
0.89
0.89
0.88
0.88
Most Negatively Correlated Segments
yhzD
yvaM
ybbF
ybbC
ybbE
ybbD
S402
S738
kamA
yodQ
-0.85
-0.84
-0.84
-0.84
-0.84
-0.84
-0.83
-0.83
-0.83
-0.82
Expression Profile of Segment rbgA
Show/Hide
Annotation of Gene rbgA
Show/Hide
function
16.2: Construct biomass (Anabolism)
function
16.6: Maintain
inference
ab initio prediction:AMIGene:2.0
codon_start
1
product
ribosome biogenesis GTPase A
transl_table
11
note
Evidence 1a: Function experimentally demonstrated in the studied strain; PubMedId: 12682299, 16390447, 16431913, 17613524; Product type e: enzyme
db_xref
GI:2633977
protein_id
CAB13478.1
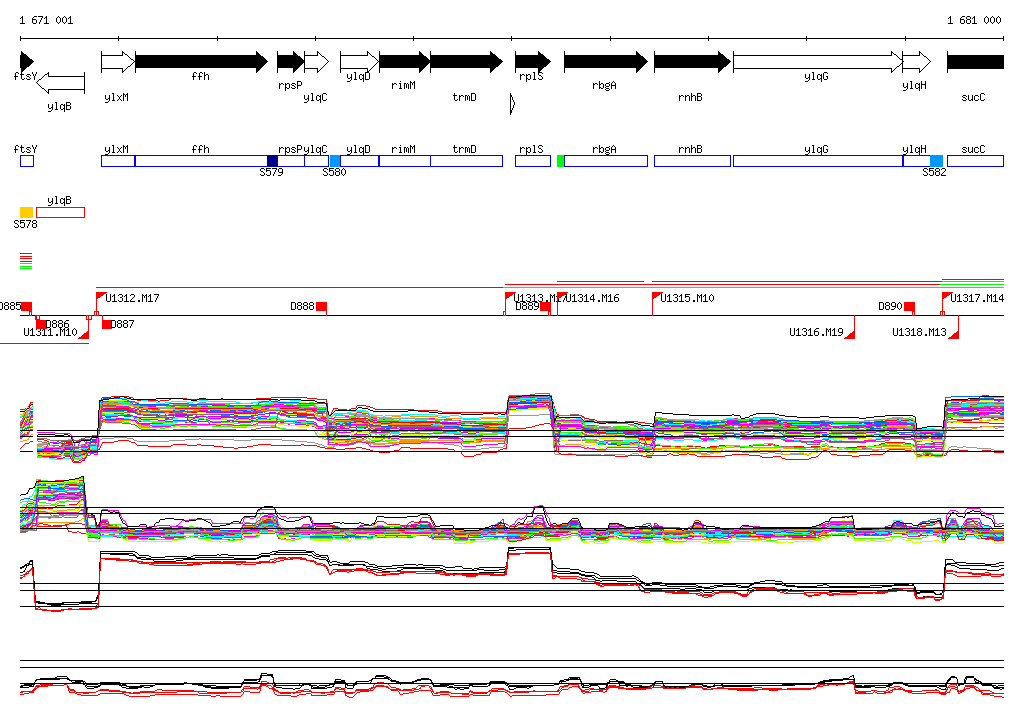
Genomic View of Gene/Segment rbgA
Show/Hide
(Legend)
Browse Genome Context