| Start Page |
|
 |
| Start Page |
|
|
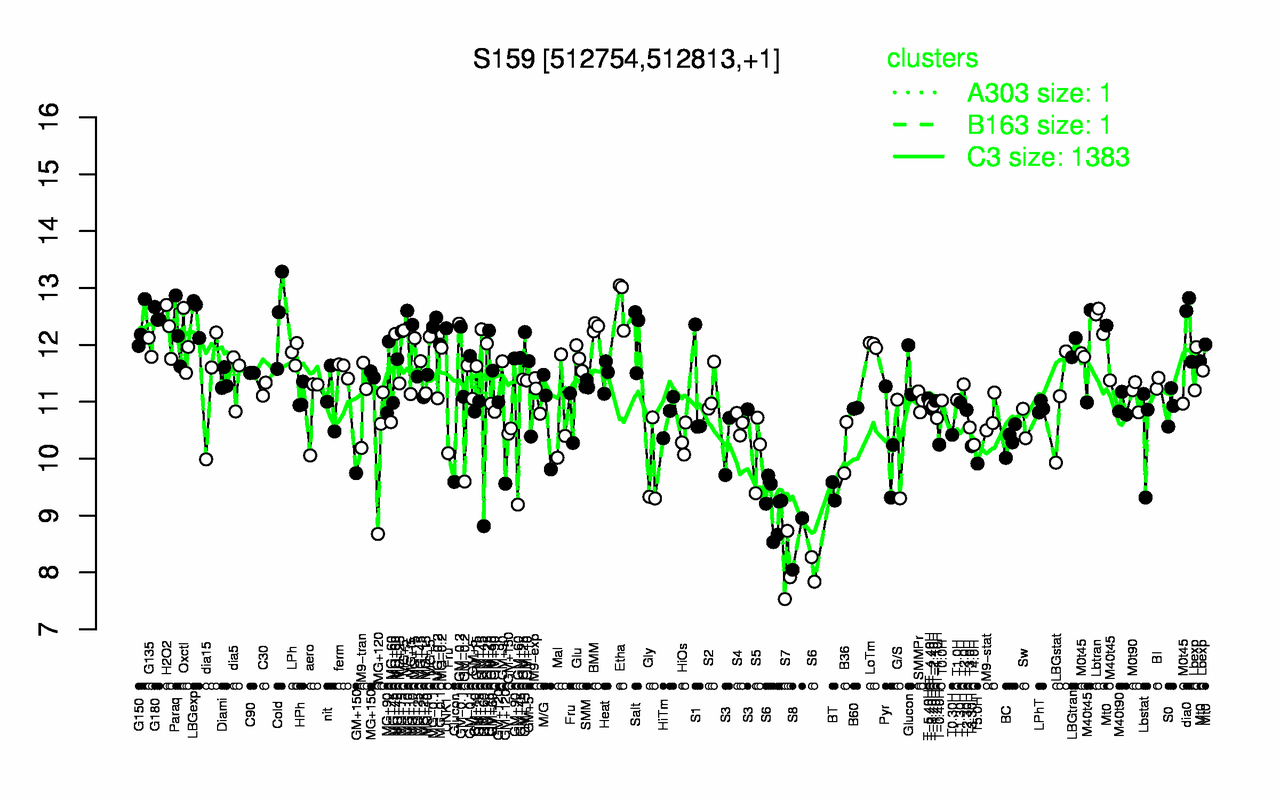
| Etha | LBGexp | G180 | Cold | Lbtran | dia0 | G150 | BMM | UNK1 | MG-0.1 |
| 12.8 | 12.5 | 12.5 | 12.5 | 12.5 | 12.4 | 12.3 | 12.3 | 12.3 | 12.3 |
| S7 | S8 | S6 | BT | Gly | GM+60 | T5.0H | S5 | MG+120 | G/S |
| 8.06 | 8.5 | 8.92 | 9.43 | 9.79 | 9.85 | 9.91 | 10.1 | 10.2 | 10.2 |